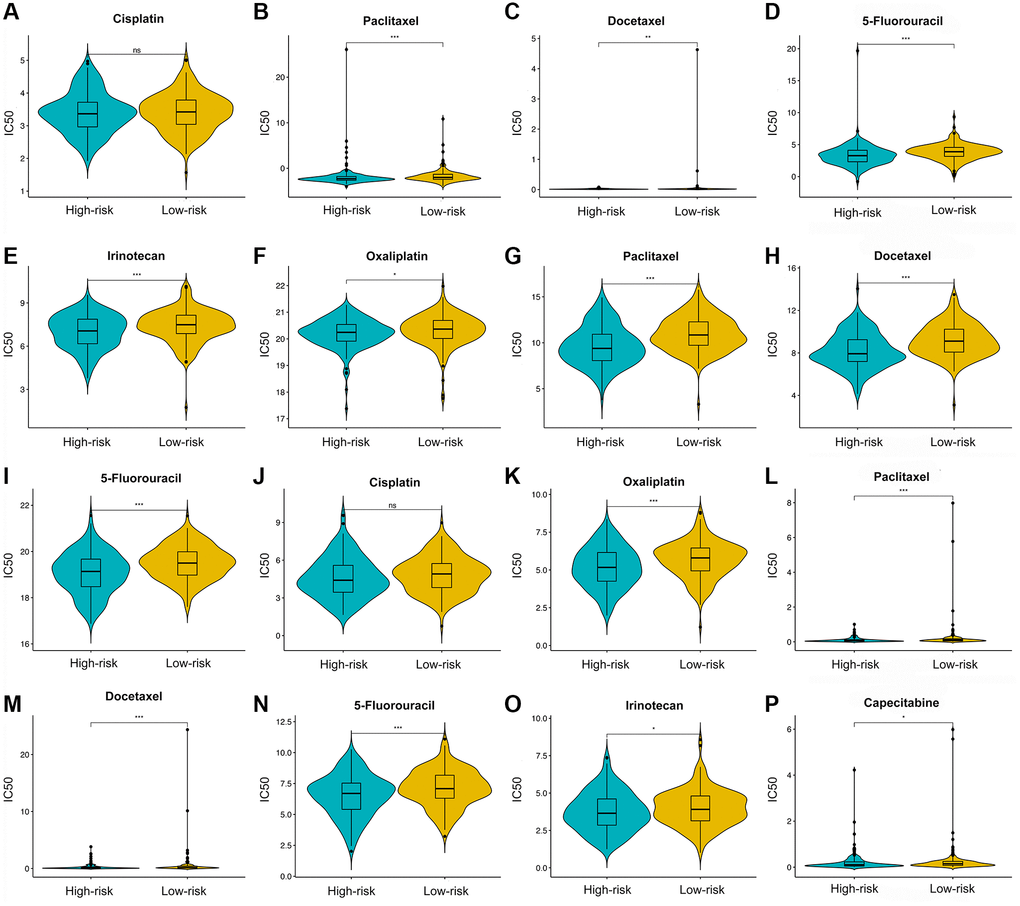
Figure 10.Chemotherapy drugs’ sensitivity of the high- versus low-risk group. Differential analysis of IC50 for chemotherapy drugs in CGP (A–E), CTRP (F–I), and GDSC (J–P) databases.
Figure 10 — An immune-related prognostic signature associated with immune landscape and therapeutic responses in gastric cancer | Aging