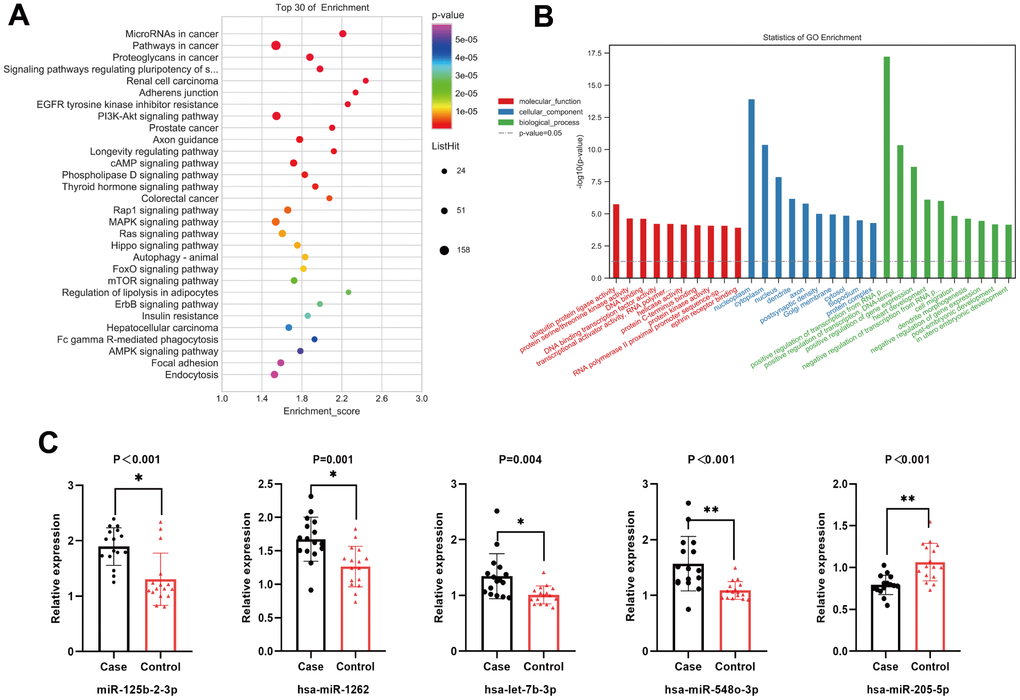
Figure 3.(A) Top 20 statistically significantly enriched pathways in Kyoto Encyclopedia of Genes and Genomes (KEGG) analysis. (B) Gene Ontology (GO) analysis for the target genes of five differentially expressed miRNAs. (C) The relative expression level of five differentially expressed miRNAs.