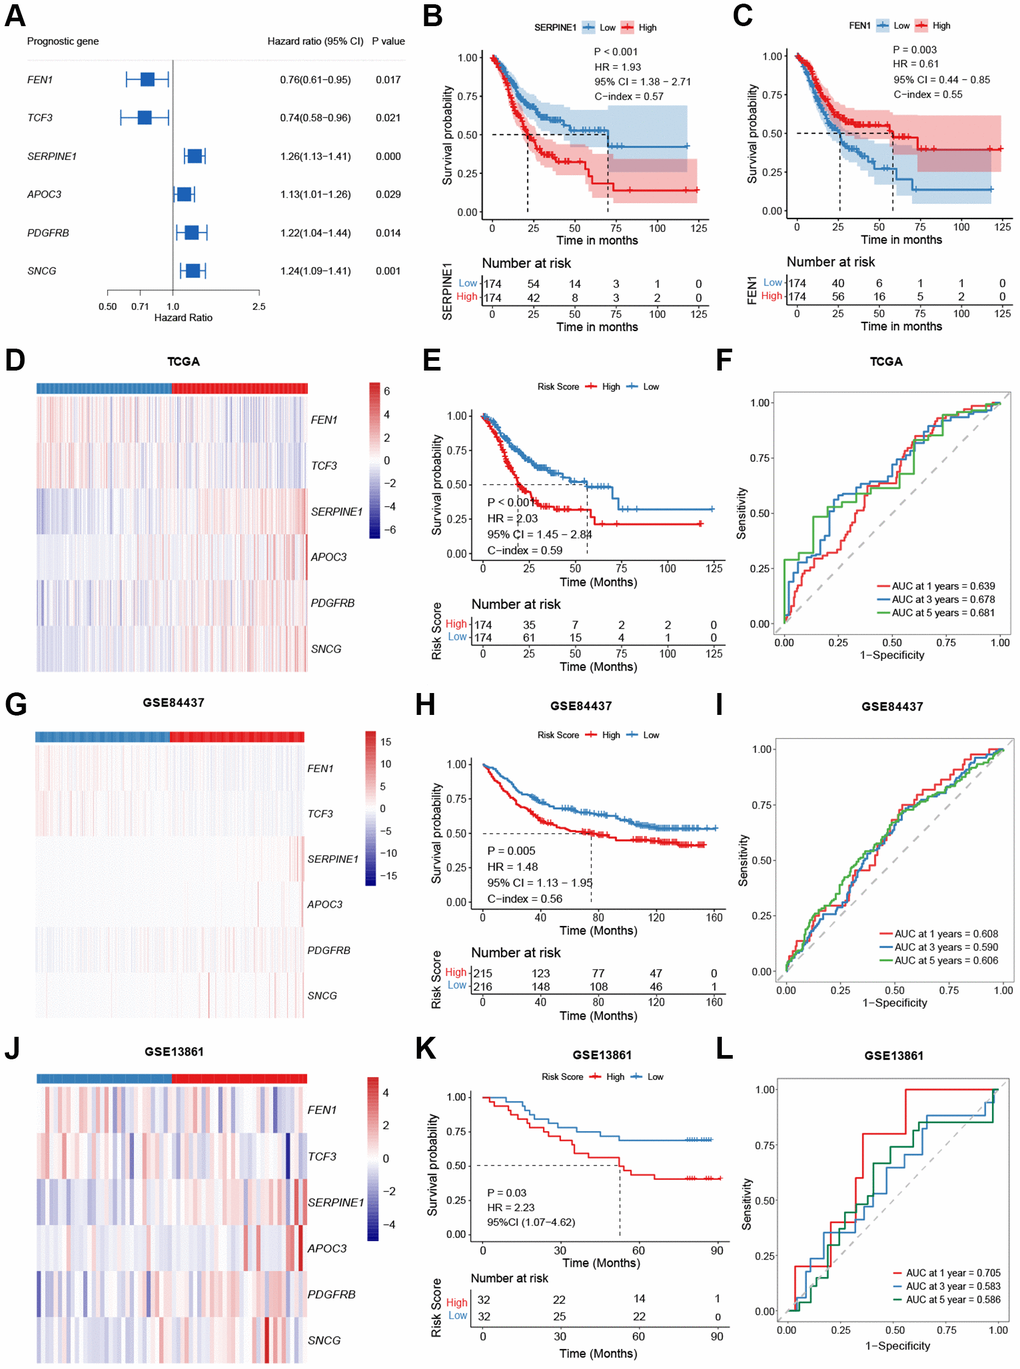
Figure 2.Model construction and validation. (A) Potential prognostic valued of each senescence-related genes in the overall survival (OS) of gastric cancer (GC). (B, C) Kaplan-Meier curves comparing the OS between patients with high and low expressions of SERPINE1 (B) and FEN1 (C), respectively. (D–L) Heatmap, Kaplan-Meier curves, and ROC curves depicting the gene expression patterns, survival status, and prognostic valued of the model in the TCGA-STAD (D–F), the GSE84437 (G–I), and the GSE13861 (J–L), respectively.