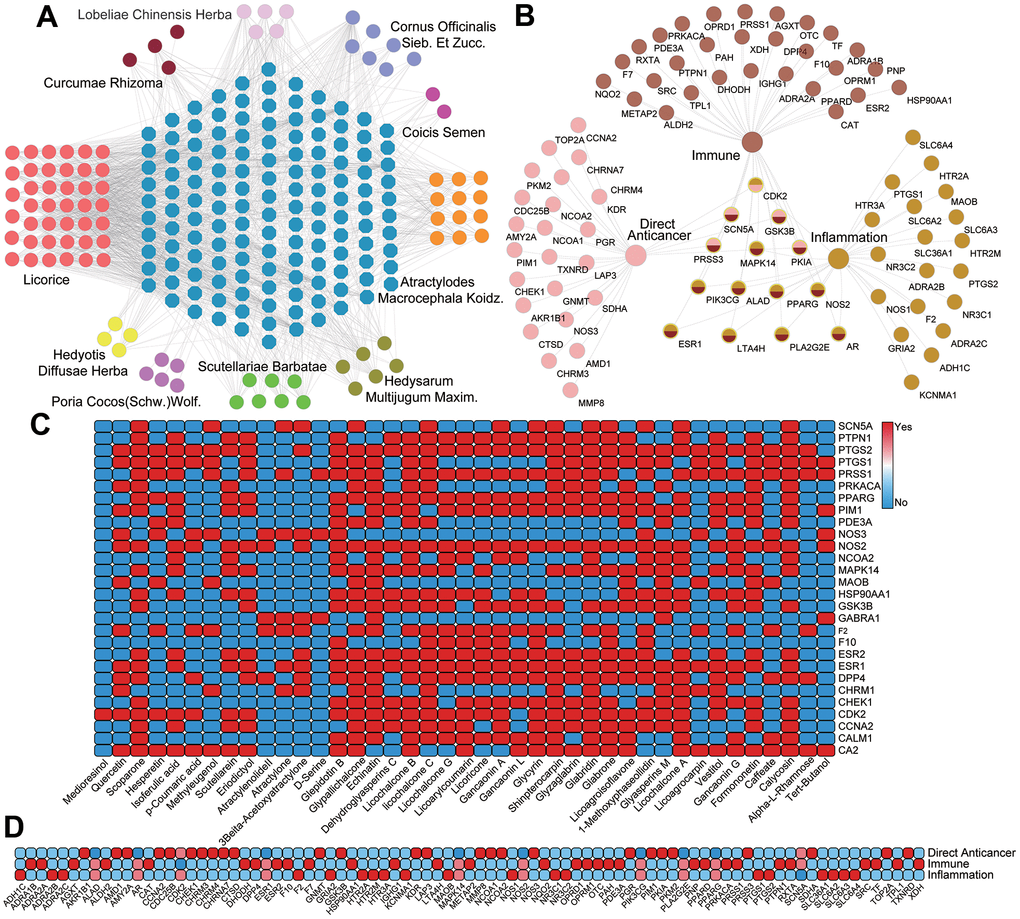
Figure 3.(A) The C-T network. Circles and octagons represent the chemicals from ten herbals and all their potential targets, respectively. (B) T-F network. 28 targets related to direct anticancer therapy 39 targets related to immunization therapy and 28 targets related to inflammation therapy. The overlapped targets in the middle are the common targets of all three therapies. (C) The heatmap of C-T interaction analysis. (D) The heatmap of T-F network analysis.