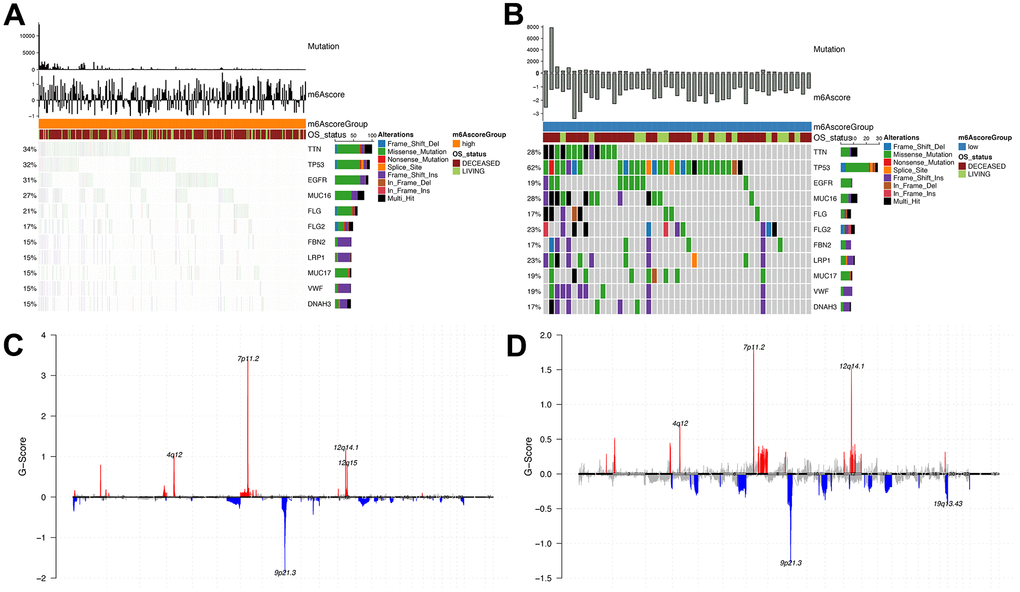
Figure 8.Analysis of molecular characteristics of m6Ascore high and low groups. (A, B) Distribution of gene mutations in samples of m6Ascore high and low groups; (C, D) The distribution of copy number amplification and deletion regions in the sample set of m6Ascore high and low groups.