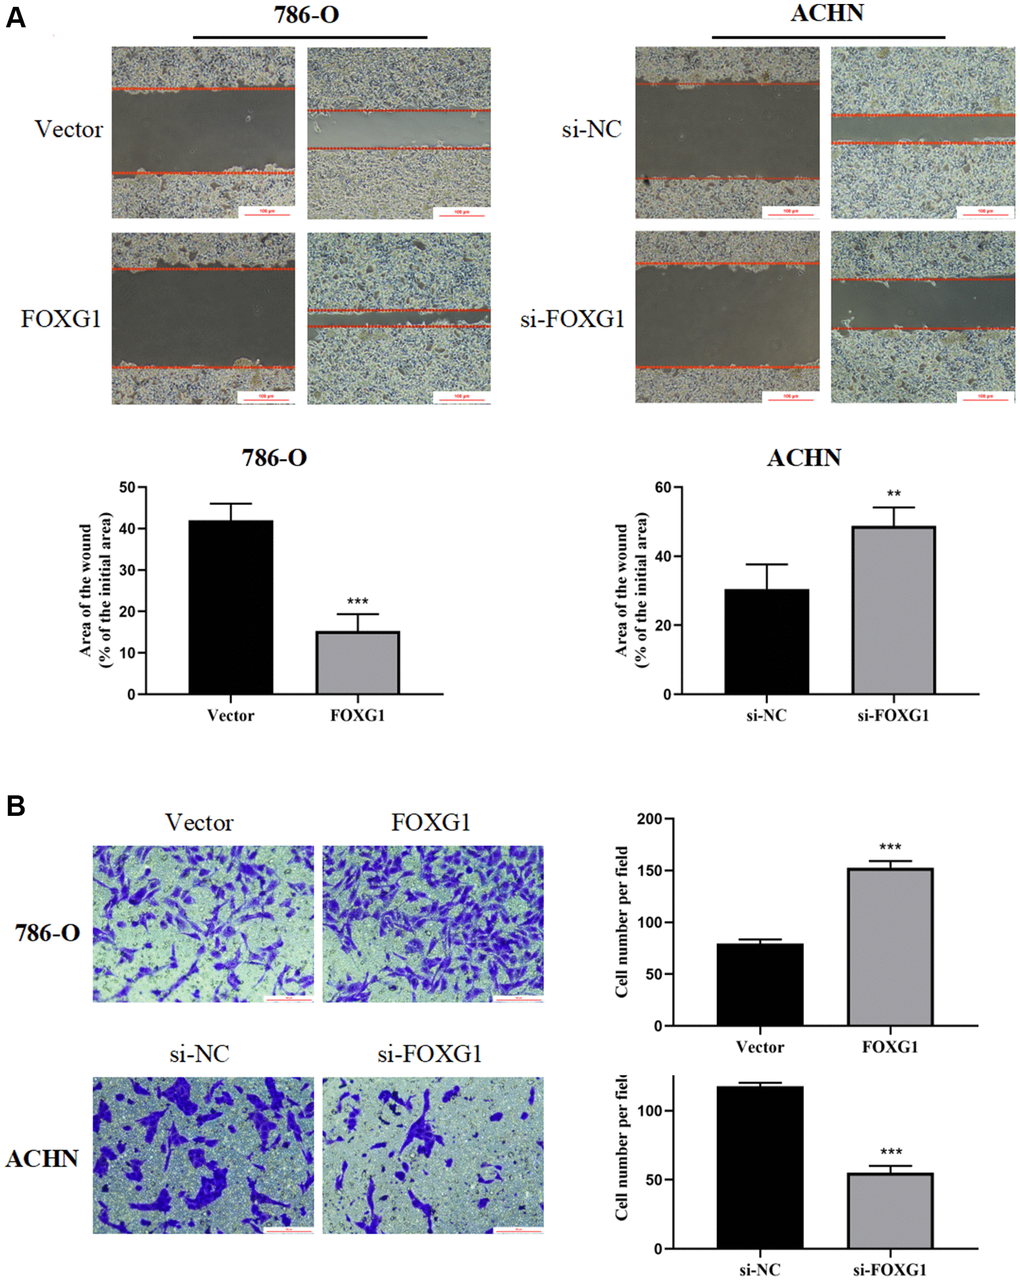
Figure 9.FOXG1 promotes migration and invasion of RCC cell lines. (A) Wound healing assay results of 786-O and ACHN cells after overexpression or knockdown of FOXG1. (B) Transwell assay result of 786-O and ACHN cells following FOXG1 overexpression or silencing. The data are presented as the mean ± standard deviation (SD) of experiments performed in triplicate. *p < 0.05, **p < 0.01, ***p < 0.001.