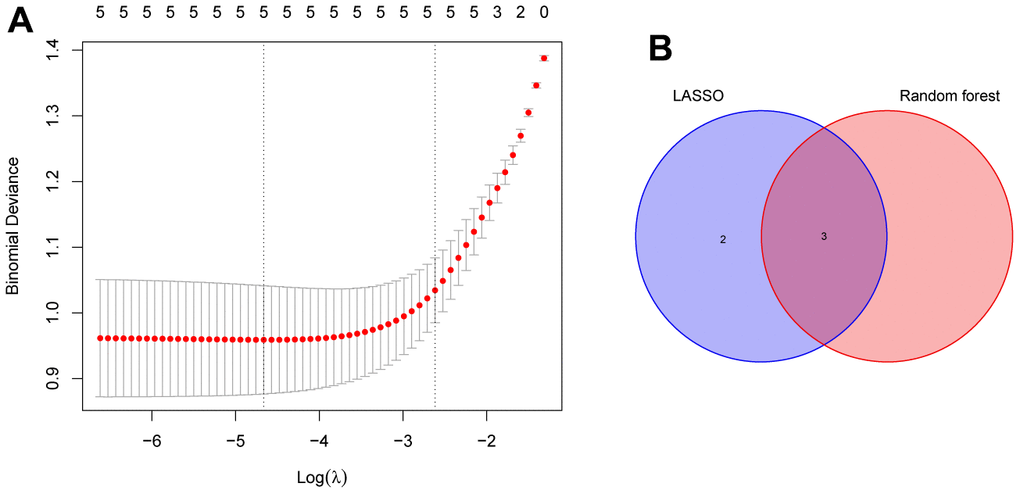
Figure 5.Identification of the reliable autophagy biomarkers of PE. (A) LASSO regression analysis of five autophagy genes among key modules and DEGs. (B) Venn plot exhibiting the reliable autophagy biomarkers among LASSO and RF model, including HK2, PLOD2, and TREM1. PE, preeclampsia. LASSO, least absolute shrinkage and selection operator. DEGs, differentially expressed genes. RF, random forest.