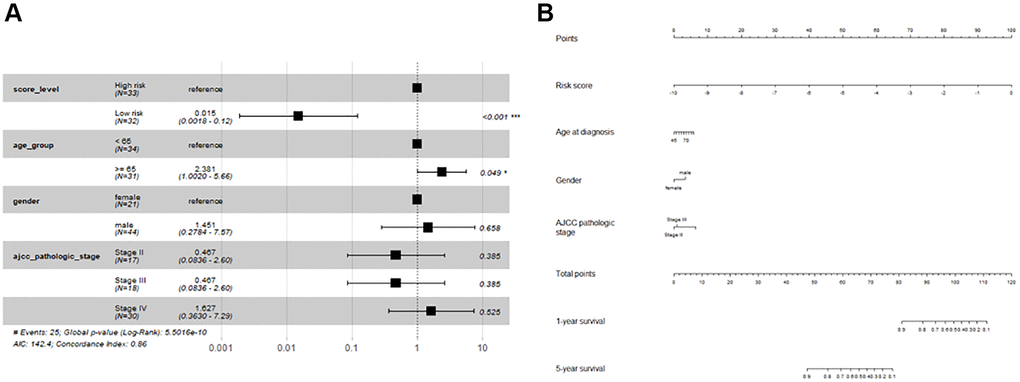
Figure 7.Forest plot and nomogram for multivariate Cox regression analysis. (A) Forest plot; (B) Nomogram.
Figure 7 — A risk score for the prognosis prediction of the muscle-invasive bladder cancer patients who received gemcitabine plus cisplatin chemotherapy | Aging