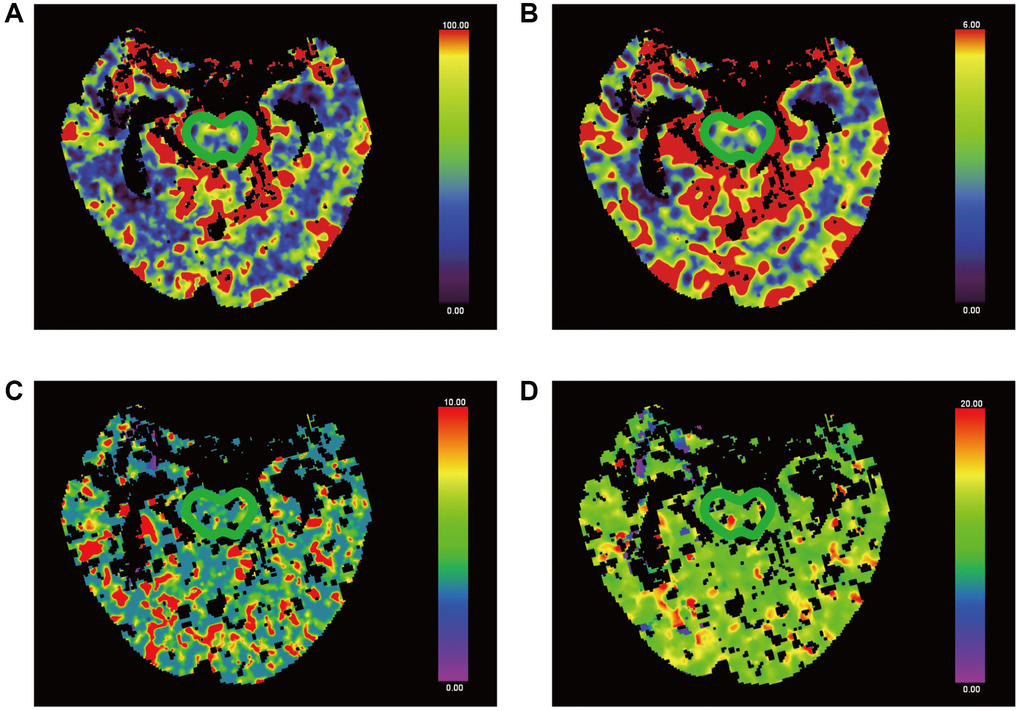
Figure 4.False-colour pictures of a 76-year-old MCS− man after right thalamus hemorrhage at the pontine level. The affected side is right. (A) The CBF map of the brainstem, (B) the CBV map, (C) the TTP map and (D) the MTT map.
Figure 4 — Relationship between consciousness level and perfusion computed tomography in patients with prolonged disorders of consciousness | Aging