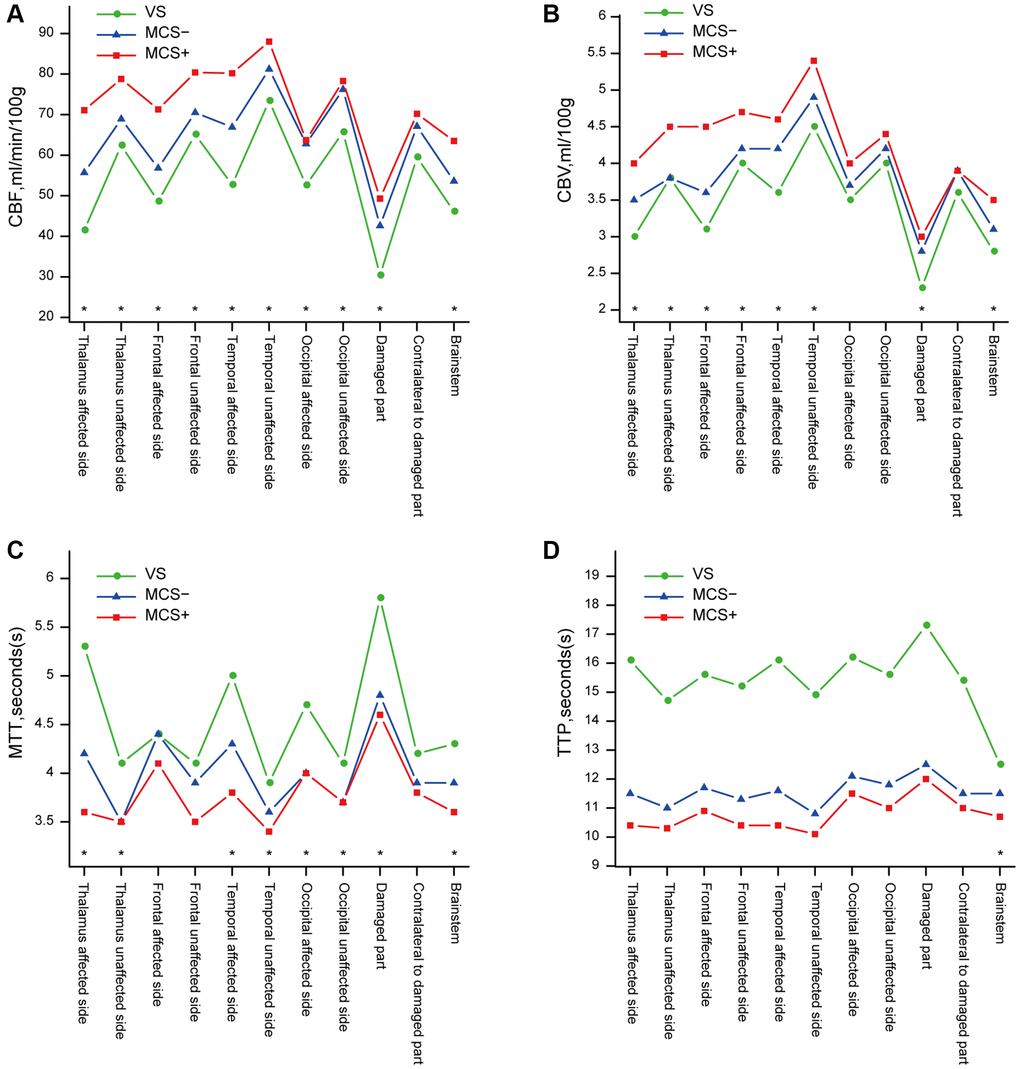
Figure 2.Differences in the results of pCT between the three types of pDOC. (A) Differences of CBF between the three types of pDOC, (B) Differences of CBV, (C) Differences of MTT, (D) Differences of TTP. *presents a statistically significant difference (p < 0.05).