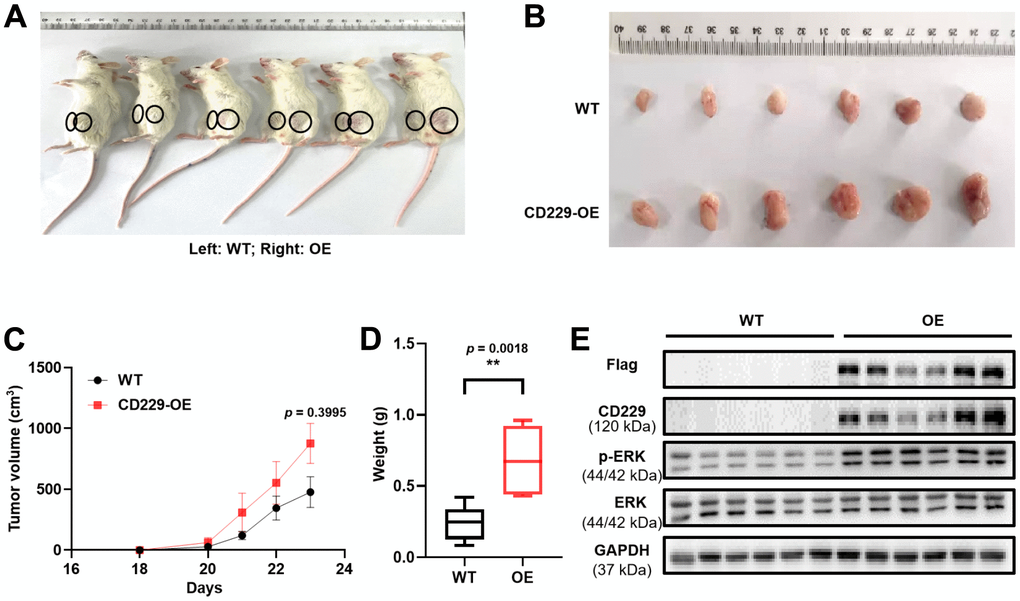
Figure 4.Overexpression of CD229 promotes MM cell proliferation in MM xenograft model. (A) Photographic images of xenograft mice were captured on Day 23. (B) Photographic images of xenografts from SCID/NOD mice. (C) Tumor volume growth curve of NOD/SCID mice. (D) Tumor weight in CD229-OE group was significantly higher than those of WT group. (E) WB assay showed that both CD229 and p-ERK expression were higher in CD229-OE group than WT group derived from xenograft tumors. The data of experiments represent Mean±SD from at least three independent experiments. **p < 0.01.