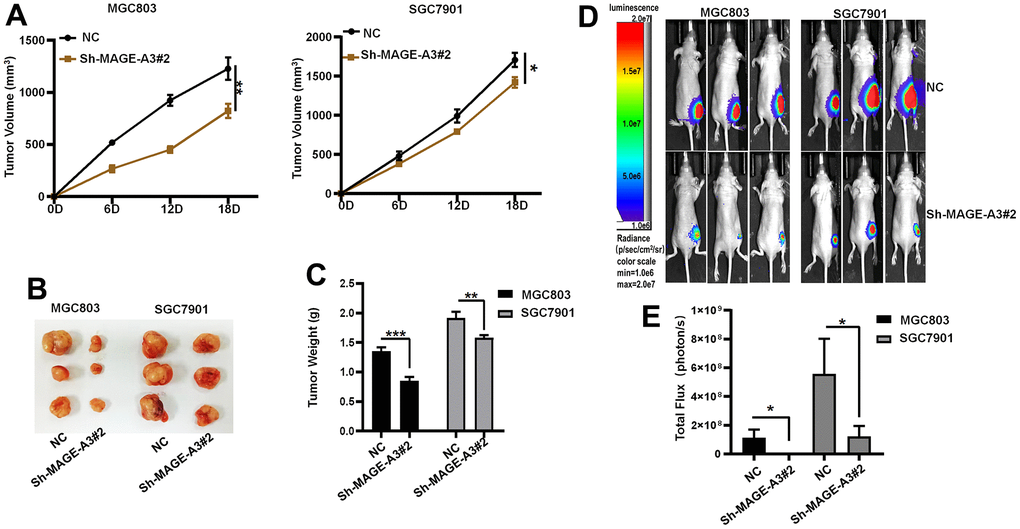
Figure 13.Verifying the ability of MAGE-A3 to regulate tumors in vivo. (A) Tumor volume growth curves of control group and knockdown group. (B) Xenograft tumors of sacrificed mice at the experimental endpoint. (C) Tumor weights in control and knockdown groups. (D, E) Animal imaging technology to detect differences between control and knockdown groups. (*P< 0.05; **P< 0.01; ***P< 0.001;****P< 0.0001).