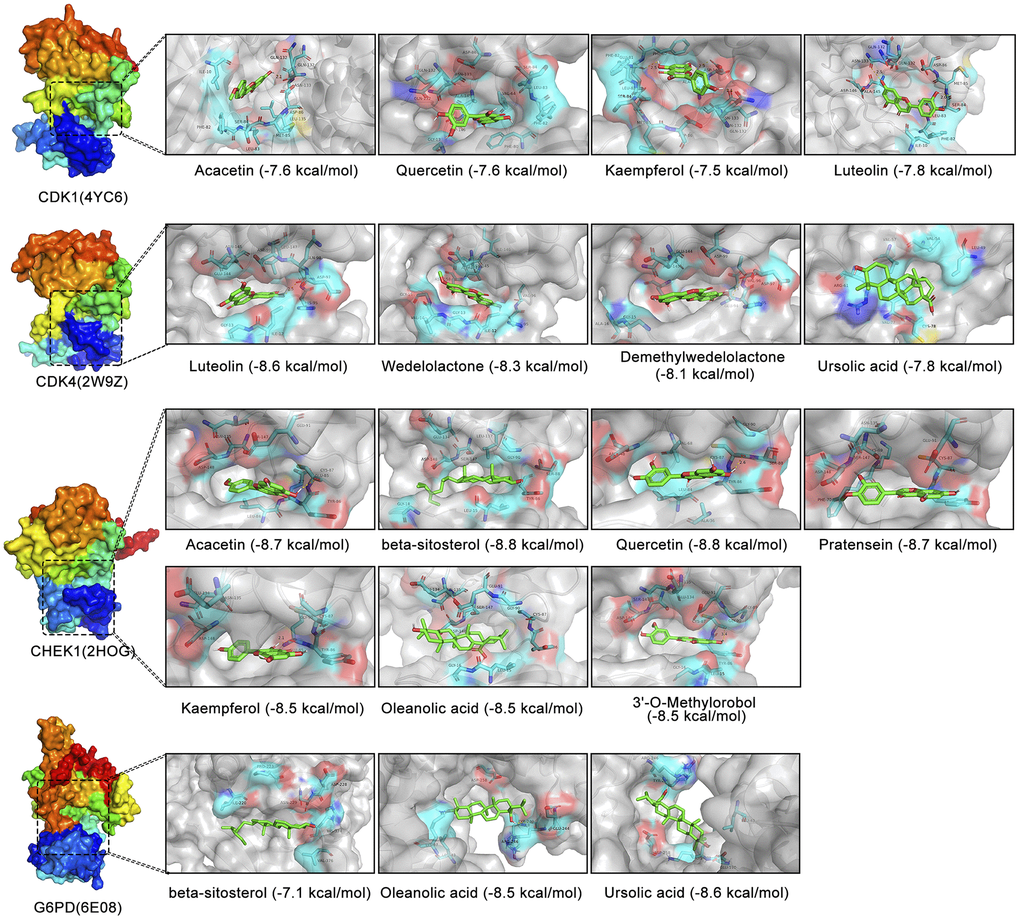
Figure 10.Molecular docking analysis of different active components in EZW and four cellular senescence-related targets. Visualization of 3D binding diagrams for protein-ligand predictions based on PyMOL software. Cyan represents the surrounding amino acid residues in the binding pocket, and green represents the active ingredients.