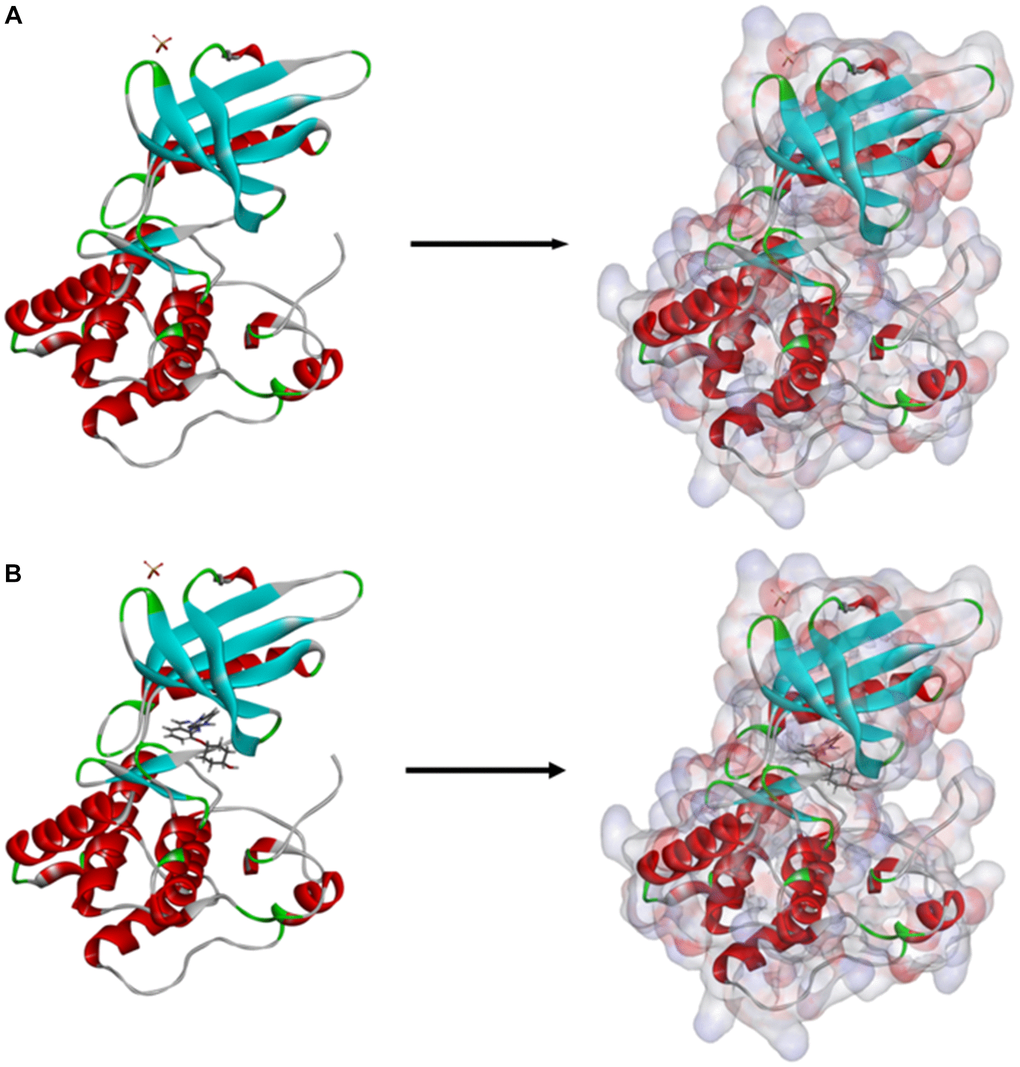
Figure 7.(A) The molecular structure of TNIK. Initial molecular structure was shown, and the surface of the molecule was added. (B) The complex structure of TNIK with NCB-0846. Initial complex structure was shown, and the surface of the complex was added. Blue represented positive charge, red represented negative charge.