Submit an Article
Navigate
Home
Editorial Board
Editorial Policies
Current Volume
Archive
Scientific Integrity
Publication Ethics Statements
Interviews with Outstanding Authors
Newsroom
Sponsored Conferences
Podcast
Contact
Special Collections
Submit an Article
Online ISSN: 1945-4589
Research Paper
|
Volume 14, Issue 19
|
pp. 8095–8109
Development and assessment of diabetic nephropathy prediction model using hub genes identified by weighted correlation network analysis
Back to article
Figure 5
(5 of 7)
−
100%
+
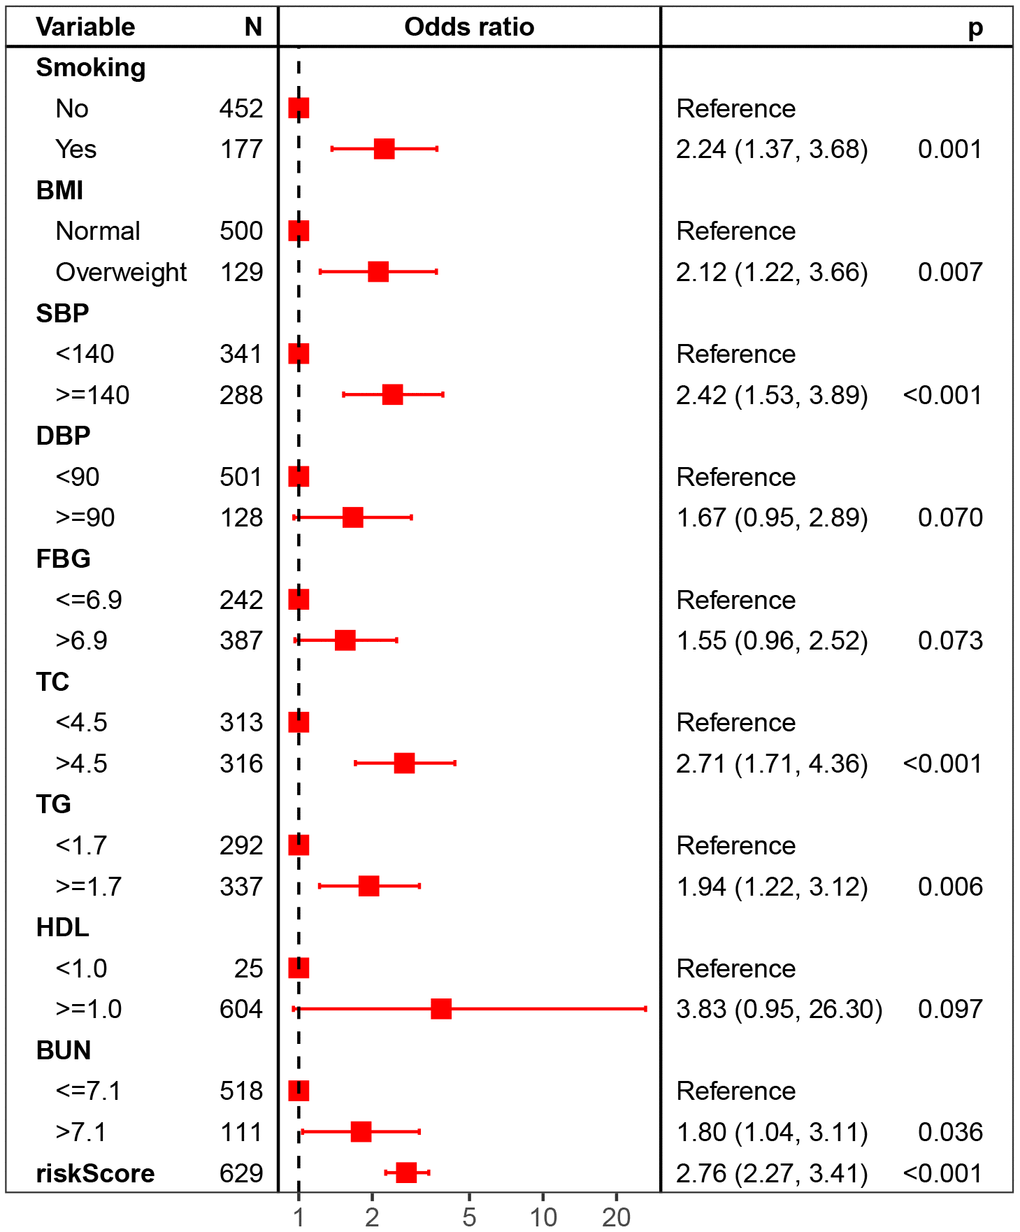
Figure 5.
Forest plot of multivariate logistic regression for DN risk.
Figure 5 — Development and assessment of diabetic nephropathy prediction model using hub genes identified by weighted correlation network analysis | Aging