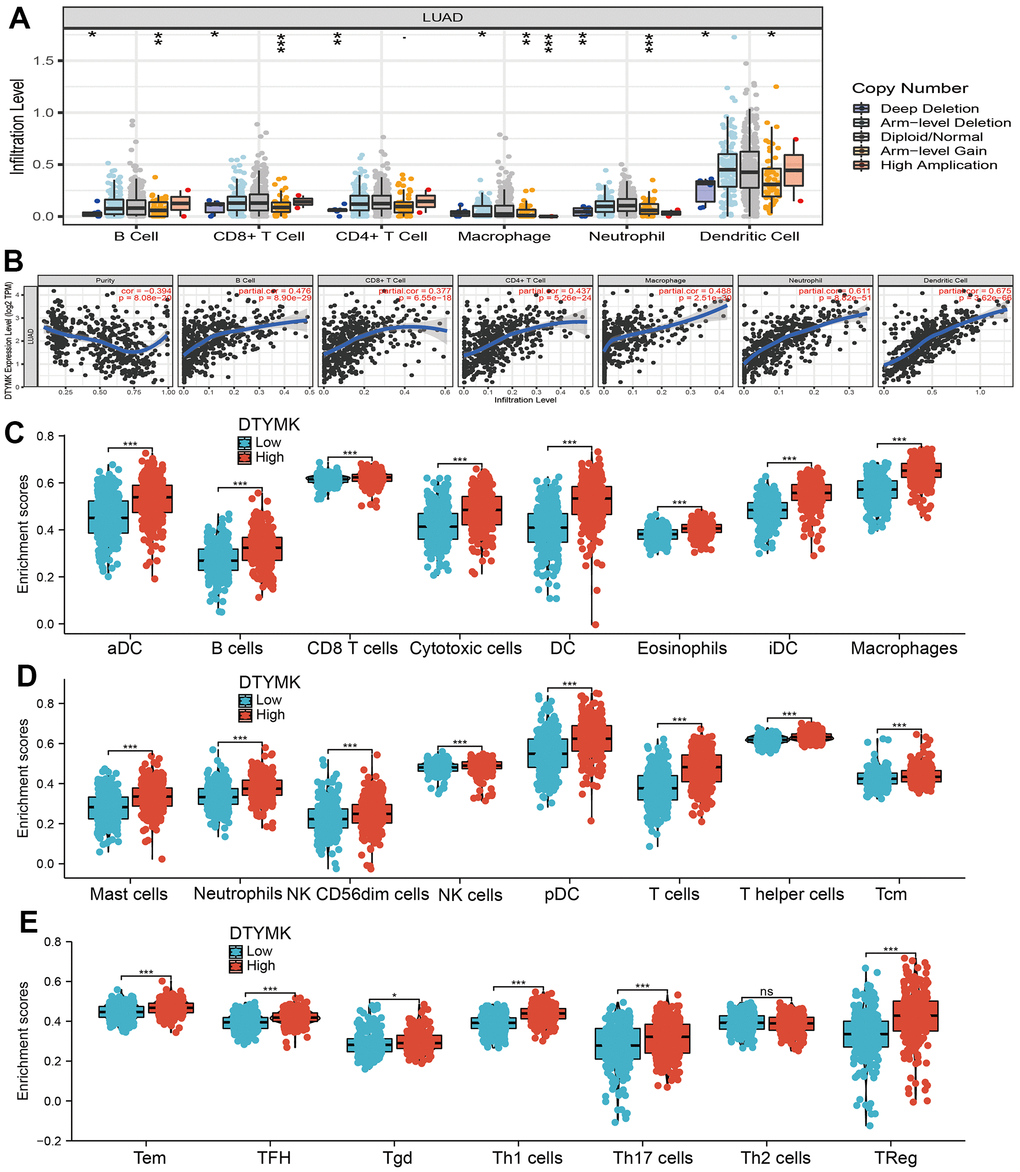
Figure 8.Correlation analysis of DTYMK expression and infiltration levels of immune cells in LUAD. (A) The correlation between DTYMK expression and somatic copy number alterations examine by TIMER. (B) The correlation between DTYMK expression and the infiltration levels of B cells, CD4+ T cells, CD8+ T cells, dendritic cells, Macrophages and Neutrophils. (C–E) Box plots of the correlations between DTYMK or molecular model expression and infiltration levels of immune cells. NS: P >0.05,*P < 0.05, **P < 0.01, ***P < 0.001.