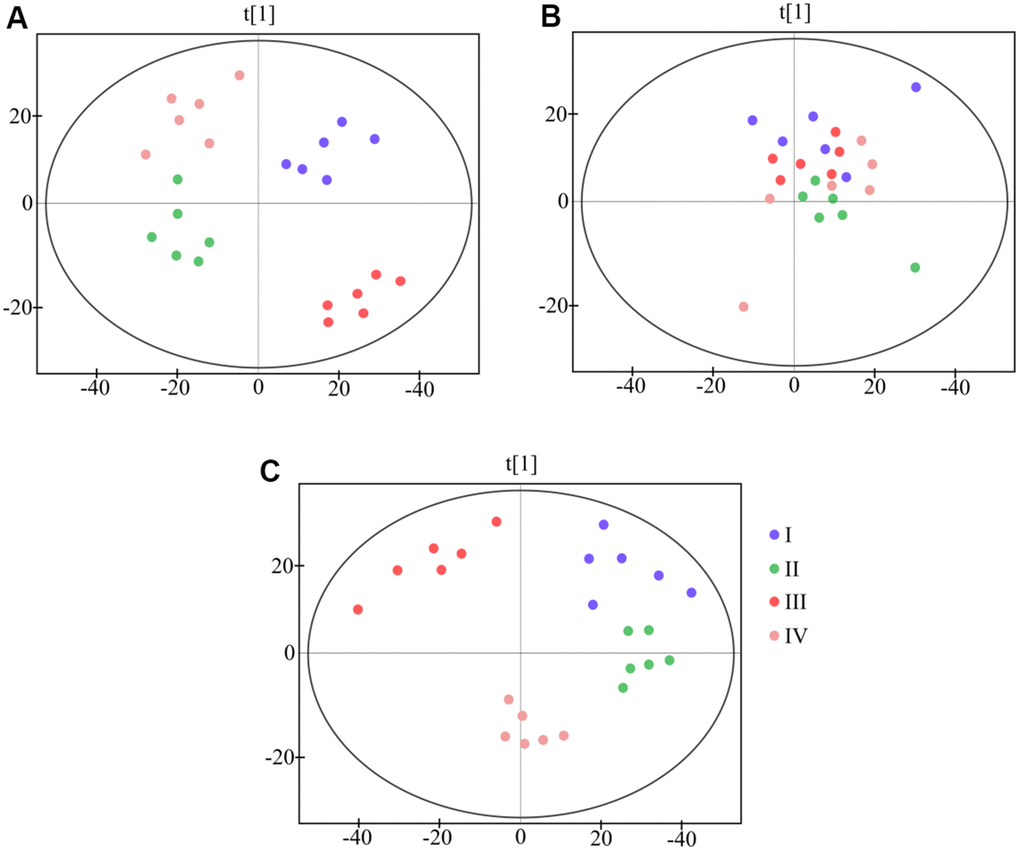
Figure 3.PCA scores plot based on 1H NMR spectra of different sample from four groups. (A) plasma (B) urine (C) feces.
Figure 3 — A multi-omics approach based on 1H-NMR metabonomics combined with target protein analysis to reveal the mechanism of RIAISs on cervical carcinoma patients | Aging