Submit an Article
Navigate
Home
Editorial Board
Editorial Policies
Current Volume
Archive
Scientific Integrity
Publication Ethics Statements
Interviews with Outstanding Authors
Newsroom
Sponsored Conferences
Podcast
Contact
Special Collections
Submit an Article
Online ISSN: 1945-4589
Research Paper
|
Volume 14, Issue 17
|
pp. 7137–7155
Identification of alanine aminotransferase 1 interaction network via iTRAQ-based proteomics in alternating migration, invasion, proliferation and apoptosis of HepG2 cells
Back to article
Figure 3
(3 of 12)
−
100%
+
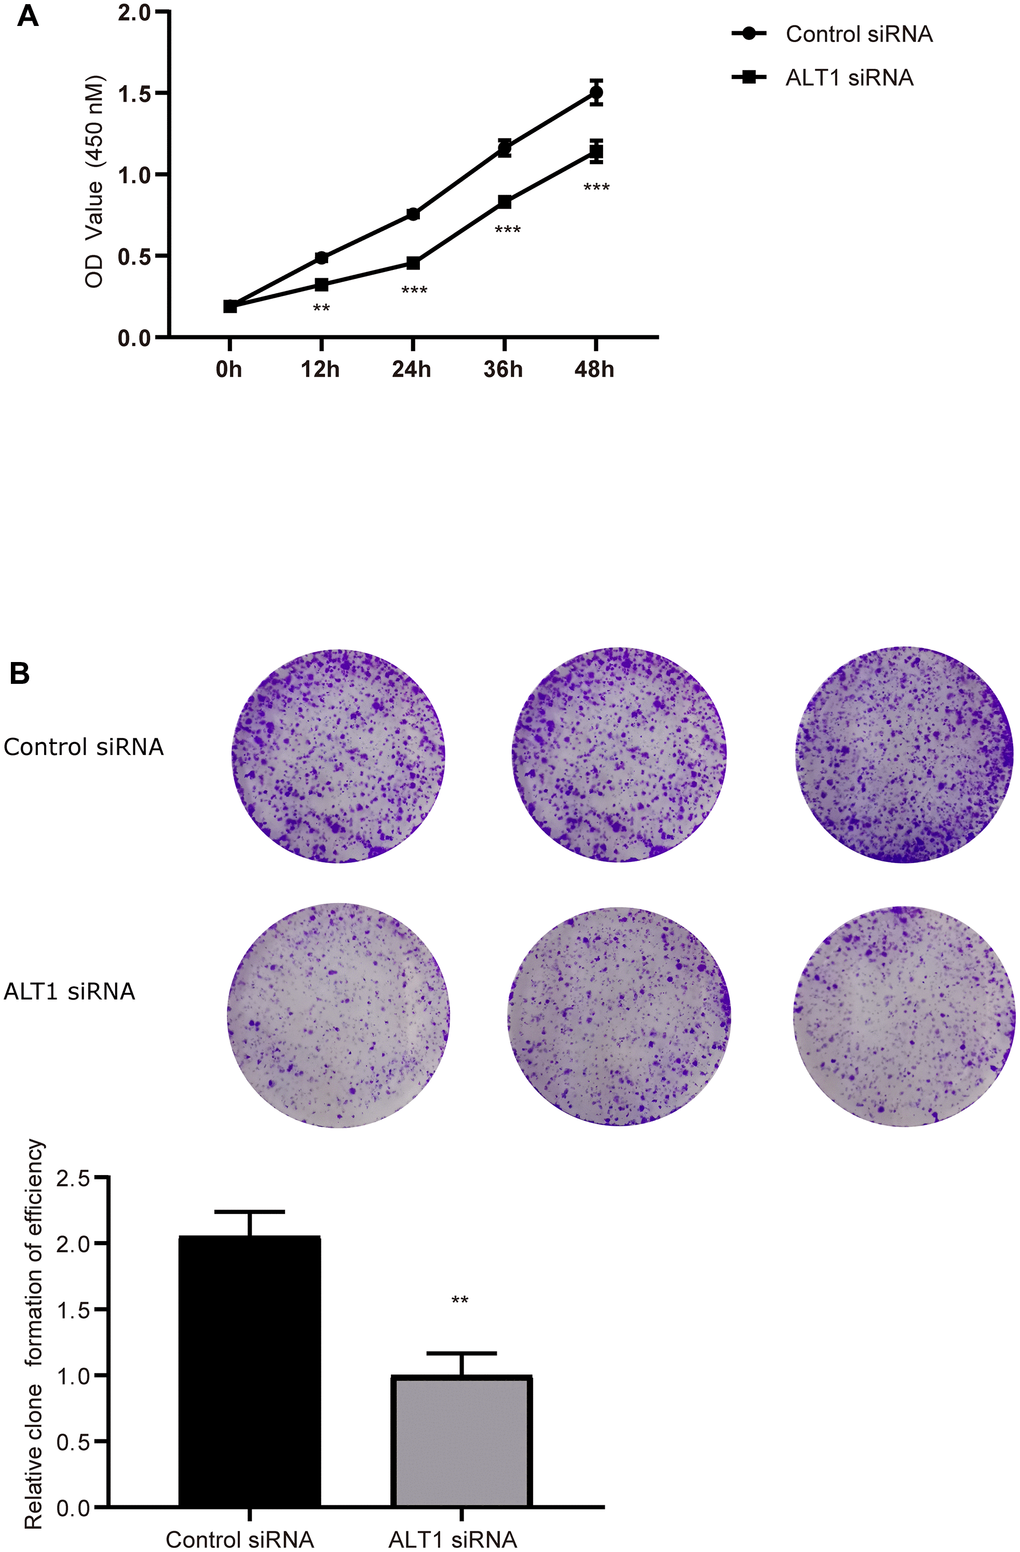
Figure 3.
(
A
) Quantitative analysis results of the CCK-8 assay of HepG2 cell. (
B
) Colony formation analysis of HepG2 cell proliferation.