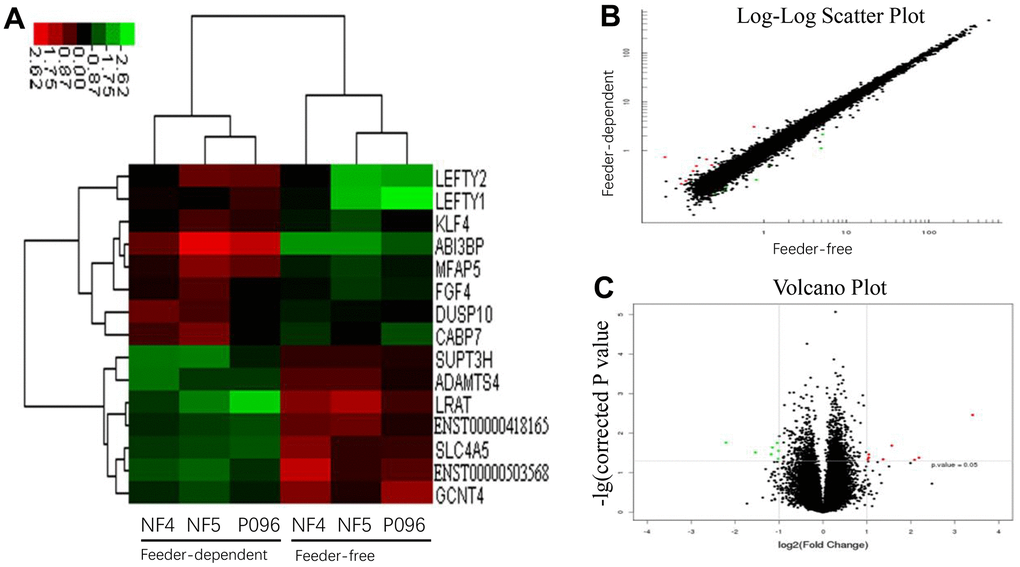
Figure 4.The profiles of the differentially-expressed genes in hESCs. (A) Hierarchical clustered heat maps show the Log2-transformed expression values of differentially-expressed genes in the feeder-free culture system and on human foreskin fibroblast feeder layers. Scatter plots (B) and volcano plots (C) of genes are of significantly different expressions.