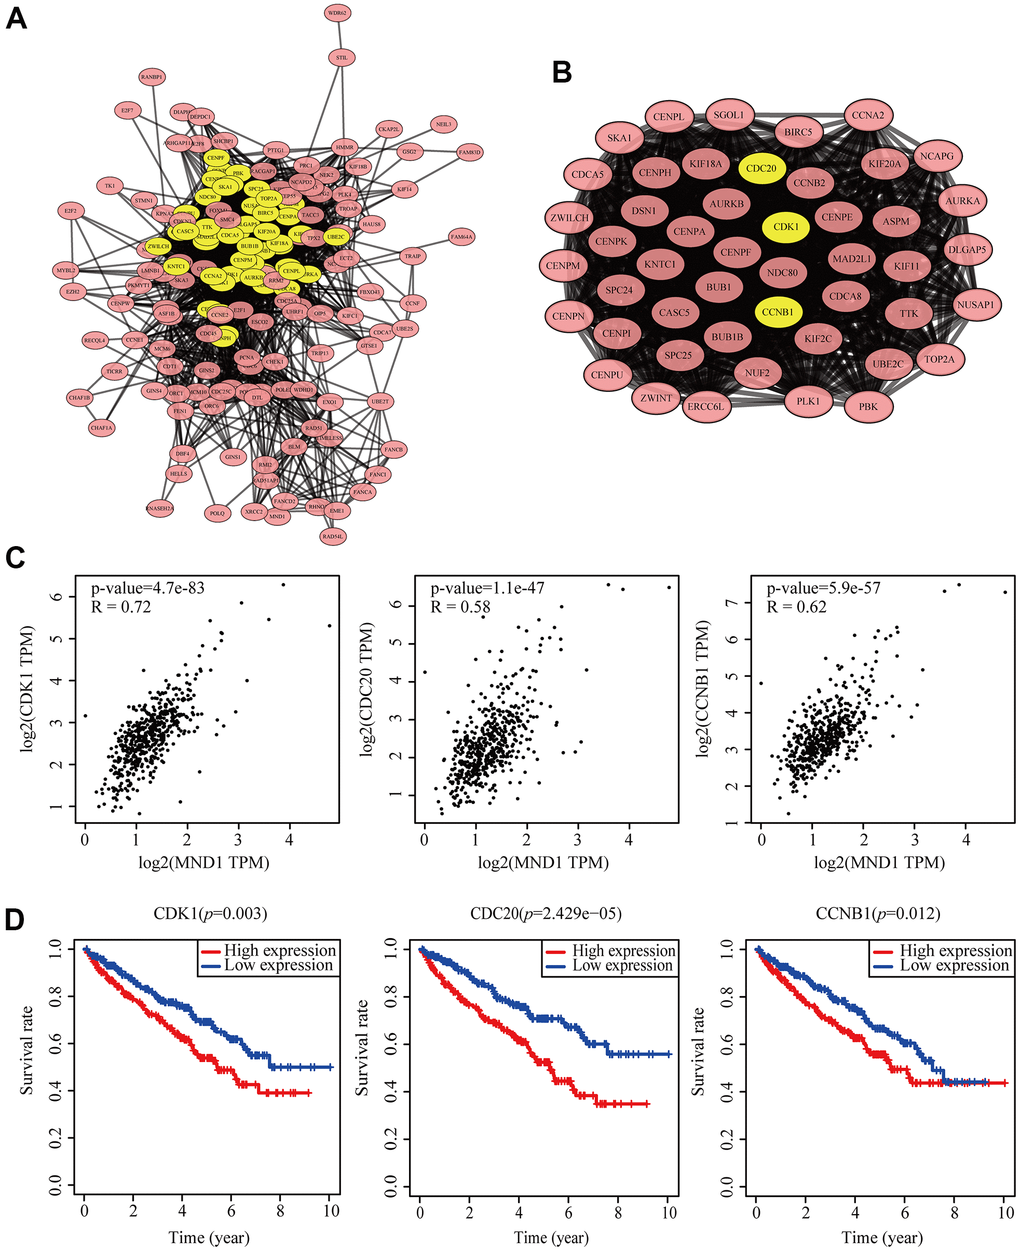
Figure 6.Protein–protein interaction network of related gene (Top200) and analysis of hub genes in KIRC. (A) Protein–protein interaction based on (PPI) network (B), MCODE analysis indicating the hub genes CDK1, CDC20, CCNB1, highlighted in yellow. (C) Correlation between MND1 and the mRNA expression of CDK1, CDC20 and CCNB1 in KIRC determined using GEPIA. (D) Prognosis analysis of correlational genes.