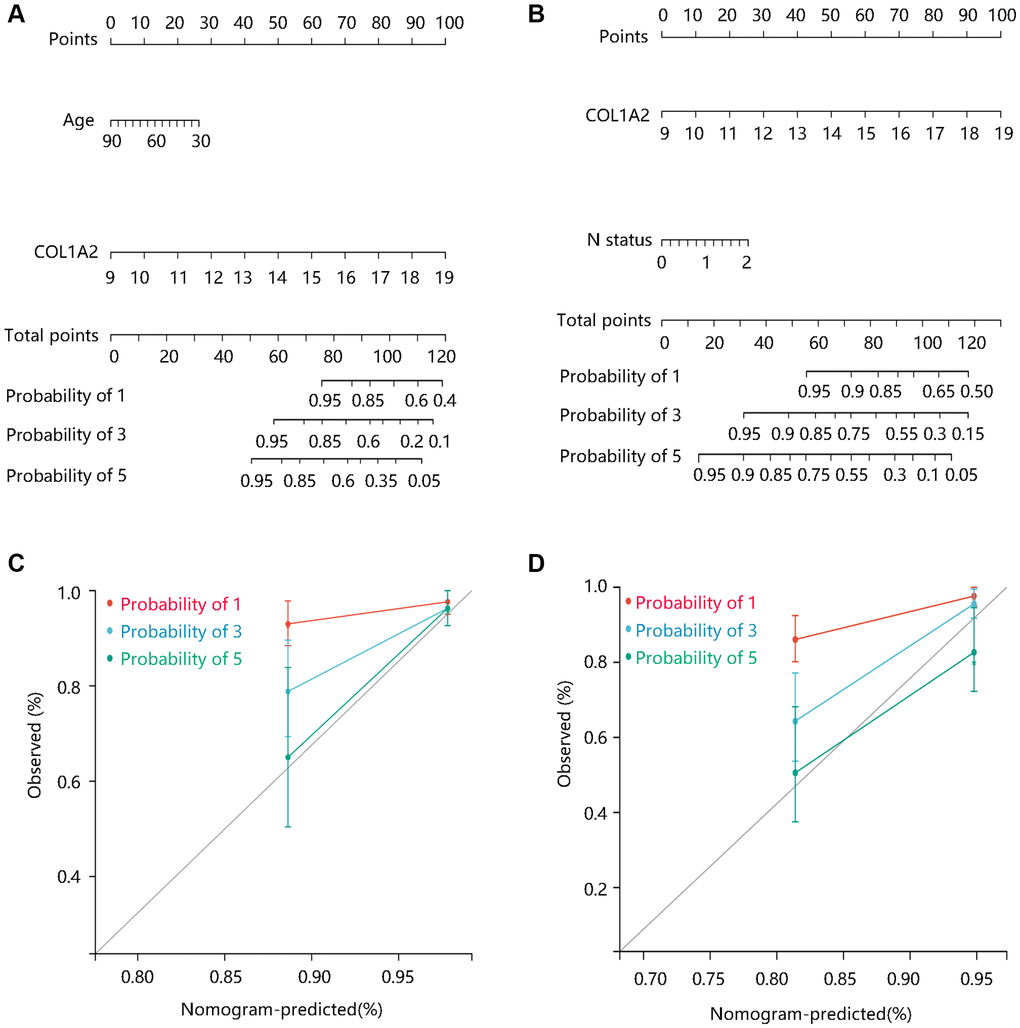
Figure 6.The construction and evaluation of nomogram models. Nomogram models based on Cox regression analysis results in terms of (A) DSS, and (B) OS. The calibration curves for the (C) DSS nomogram model and (D) OS nomogram model. Abbreviations: DSS: disease-specific survival; OS: overall survival.