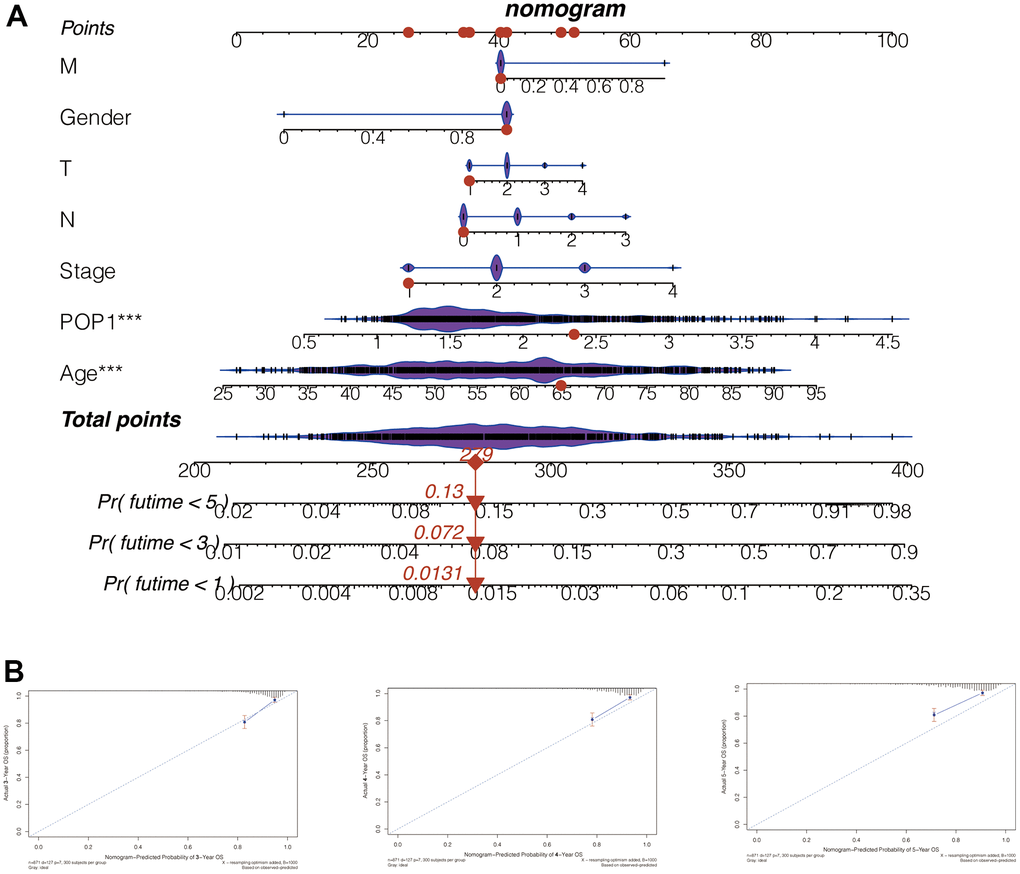
Figure 8.Nomogram to evaluate patient mortality. (A) The 1-, 3-, and 5-year mortality of BC patients predicted by this nomogram was 0.0131, 0.072, and 0.13, respectively. (B) According to the consistency between the observed and predicted values, the nomogram calibration plot of the training cohort was established. The calibration curves of 3, 4, and 5 years indicated that nomogram results are accurate.