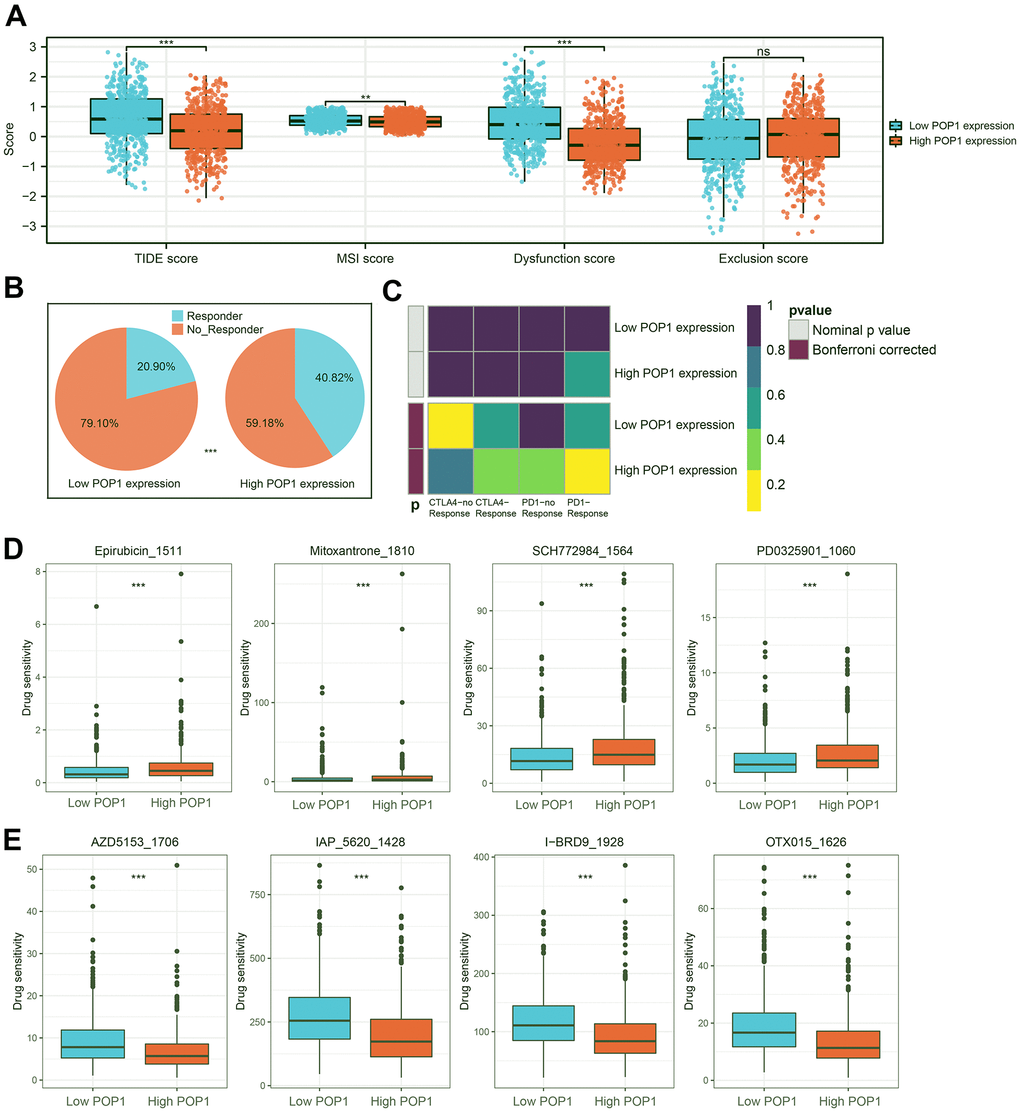
Figure 10.Immunotherapy response prediction and potential drug screening. (A) Distribution of Tumor Immune Dysfunction and Exclusion (TIDE) score, microsatellite instability (MSI) score, Dysfunction score, and Exclusion score. (B) Responder rates differed between the high- and low-POP1 groups. (C) A subclass mapping algorithm was used to verify the immunotherapy prediction results. (D, E) The drugs with the most significant difference in sensitivity between the high- and low-POP1 groups. **P < 0.01; ***P < 0.001. Abbreviations: TIDE, Tumor Immune Dysfunction, and Exclusion; MSI, Microsatellite instability.