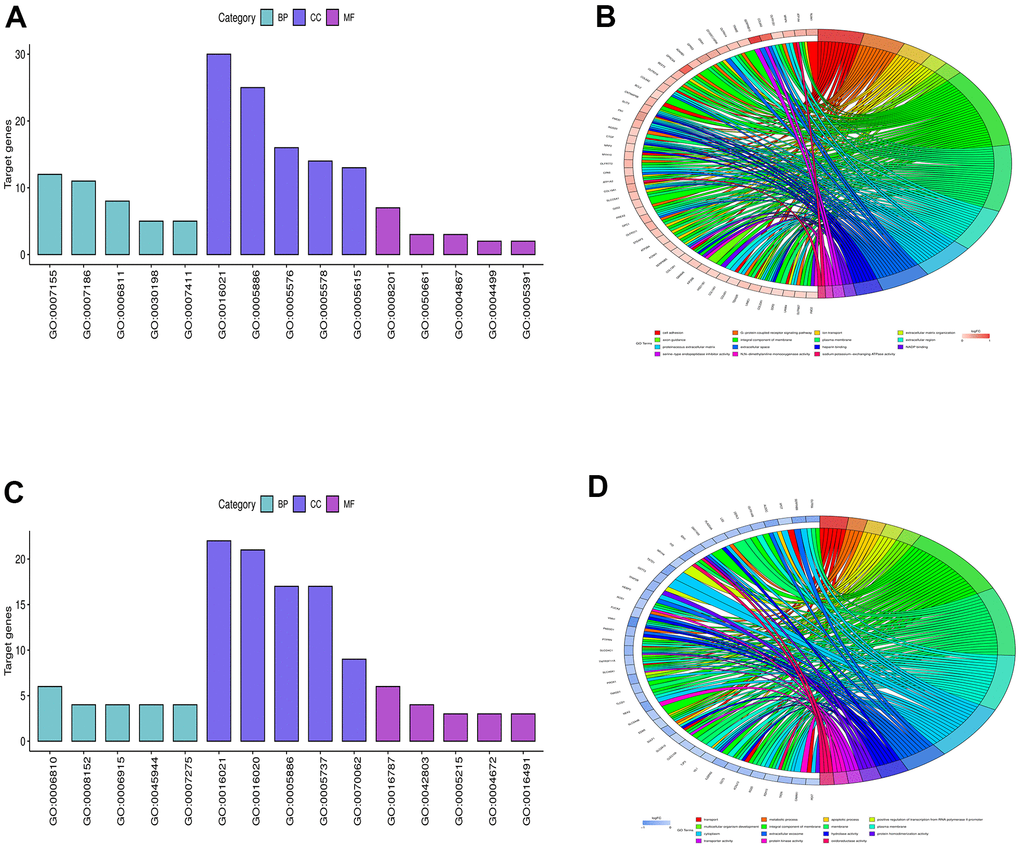
Figure 2.Bioinformatics analysis. (A, B) showed the diagrams of up-regulated GO pathways, and (C, D) represented the diagrams of down-regulated pathways of DEGs.
Figure 2 — MiR-217-5p inhibits smog (PM2.5)-induced inflammation and oxidative stress response of mouse lung tissues and macrophages through targeting STAT1 | Aging