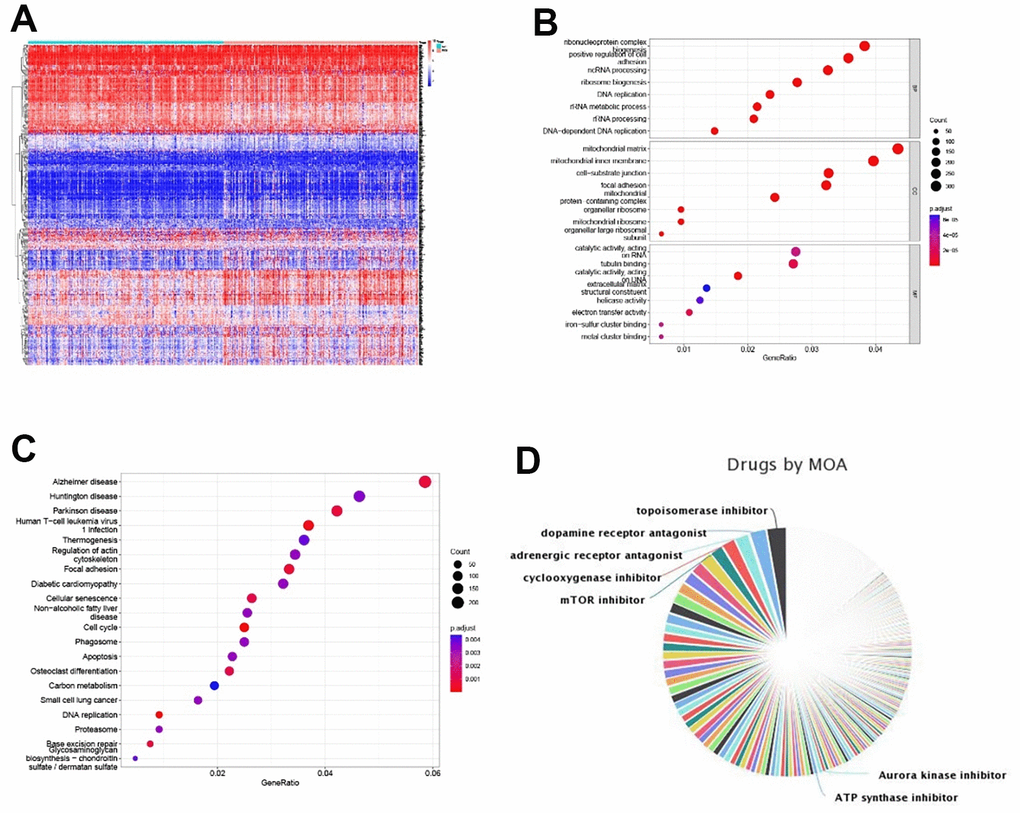
Figure 9.Tumor immune sensitive drug prediction. (A) Top 200 up- and downregulated significantly expressed genes between the high- and low-risk groups. (B, C) GO and KEGG enrichment analyses of differentially expressed genes. (D) Pie chart of tumor immune-sensitive drug types.