Submit an Article
Navigate
Home
Editorial Board
Editorial Policies
Current Volume
Archive
Scientific Integrity
Publication Ethics Statements
Interviews with Outstanding Authors
Newsroom
Sponsored Conferences
Podcast
Contact
Special Collections
Submit an Article
Online ISSN: 1945-4589
Research Paper
|
Volume 14, Issue 21
|
pp. 8700–8718
Identification and validation of a glycolysis-related gene signature for depicting clinical characteristics and its relationship with tumor immunity in patients with colon cancer
Back to article
Figure 2
(2 of 11)
−
100%
+
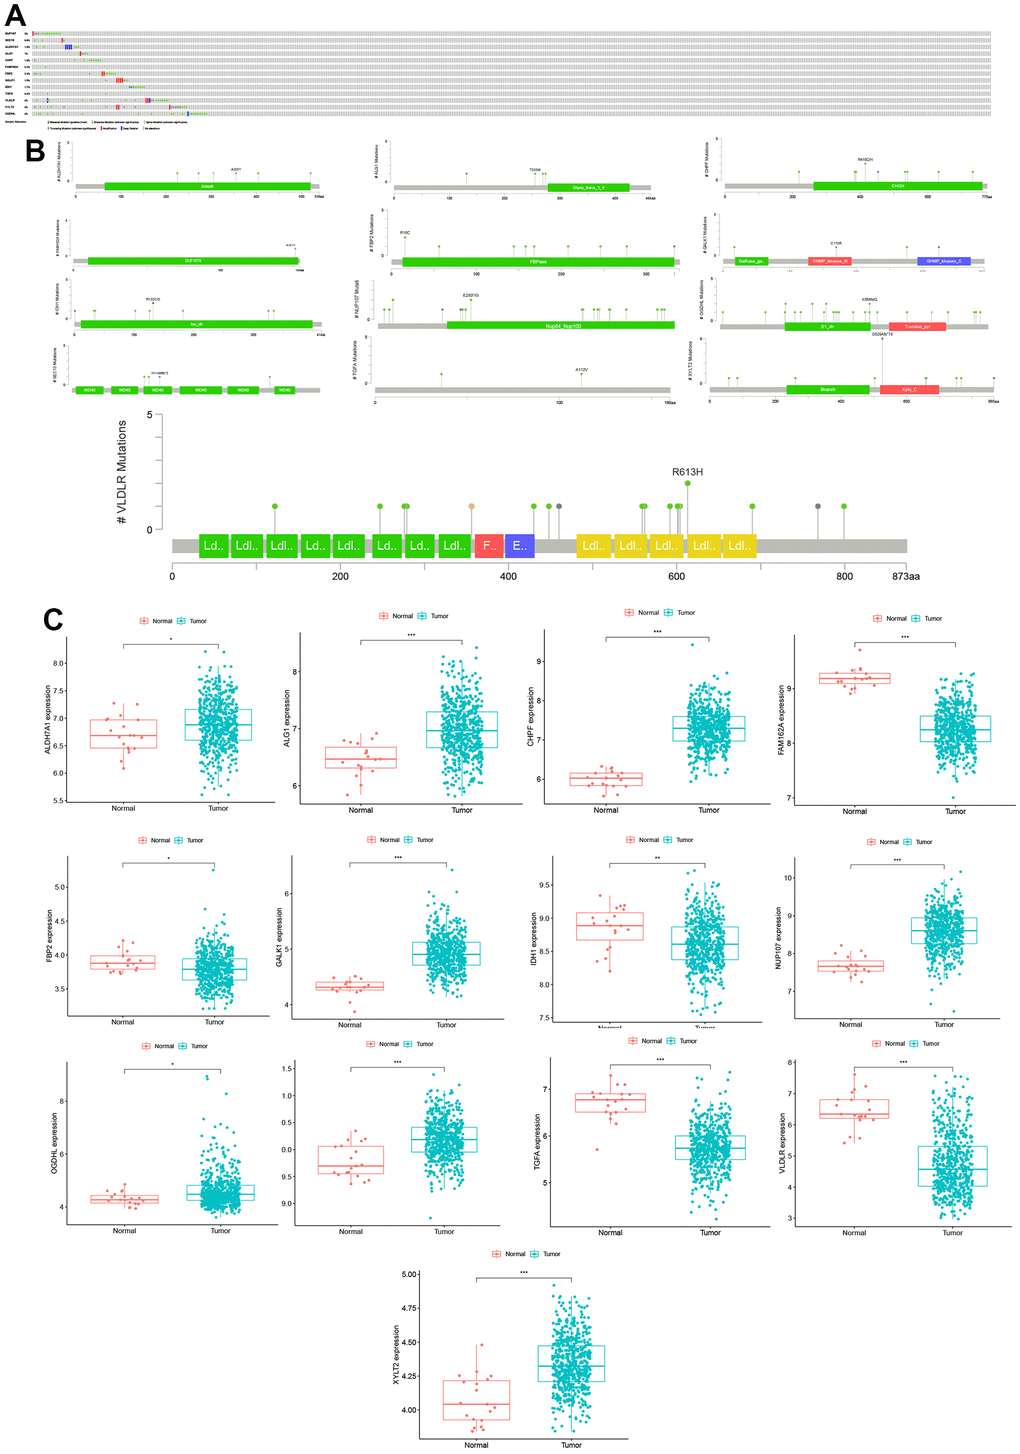
Figure 2.
Mutations and expression levels of model genes in CC.
(
A
) Mutation frequency of model genes. (
B
) Model gene-specific mutation domains. (
C
) Model gene expression between CC and normal control samples.