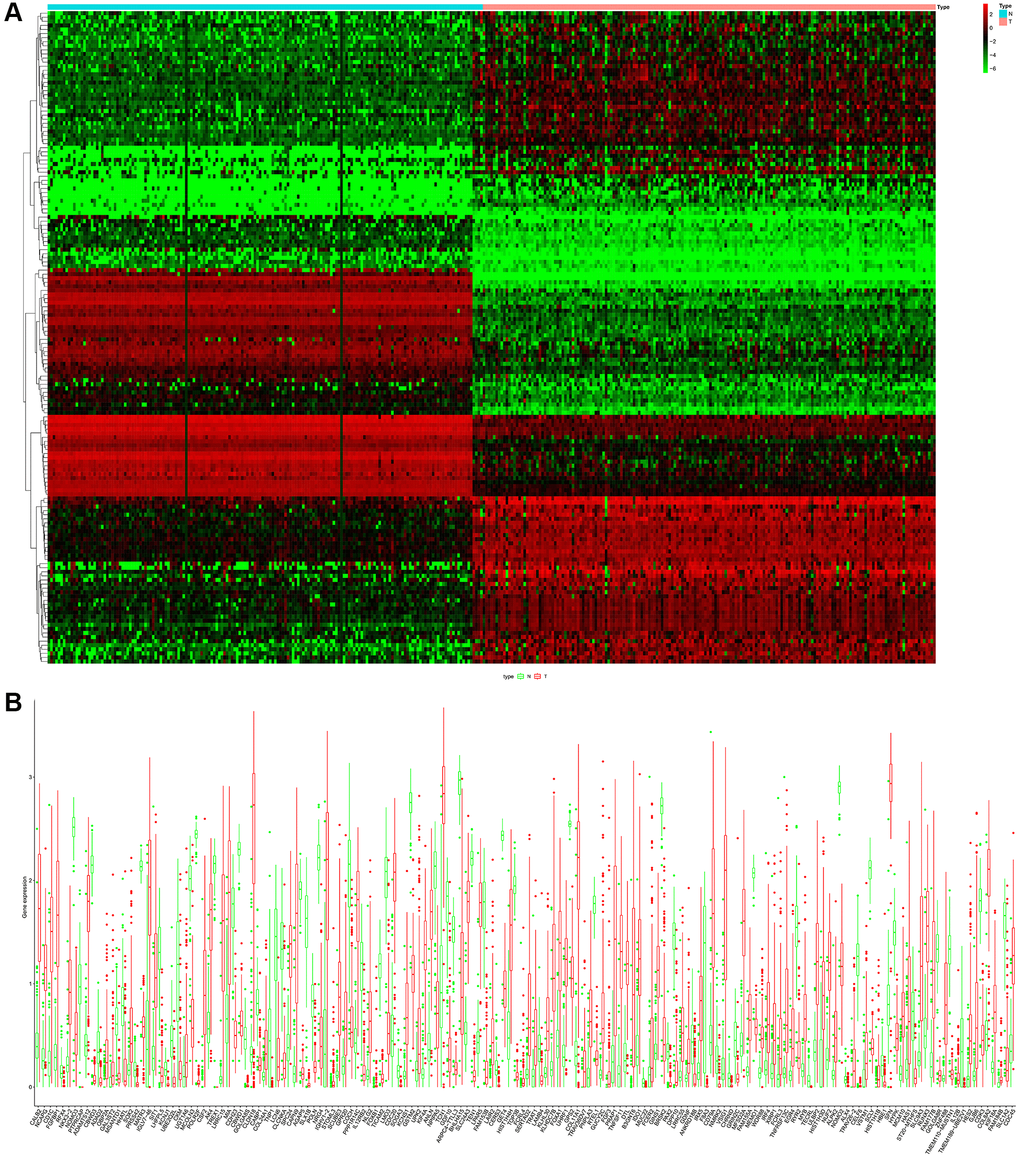
Figure 2.(A) Heatmap of the differential ARGs in the combination of GTEx data and TCGA-PAAD data. (B) Barplot of each differential ARGs between normal samples (green) and tumor samples (red).
Figure 2 — Establishing and validating an ADCP-related prognostic signature in pancreatic ductal adenocarcinoma | Aging