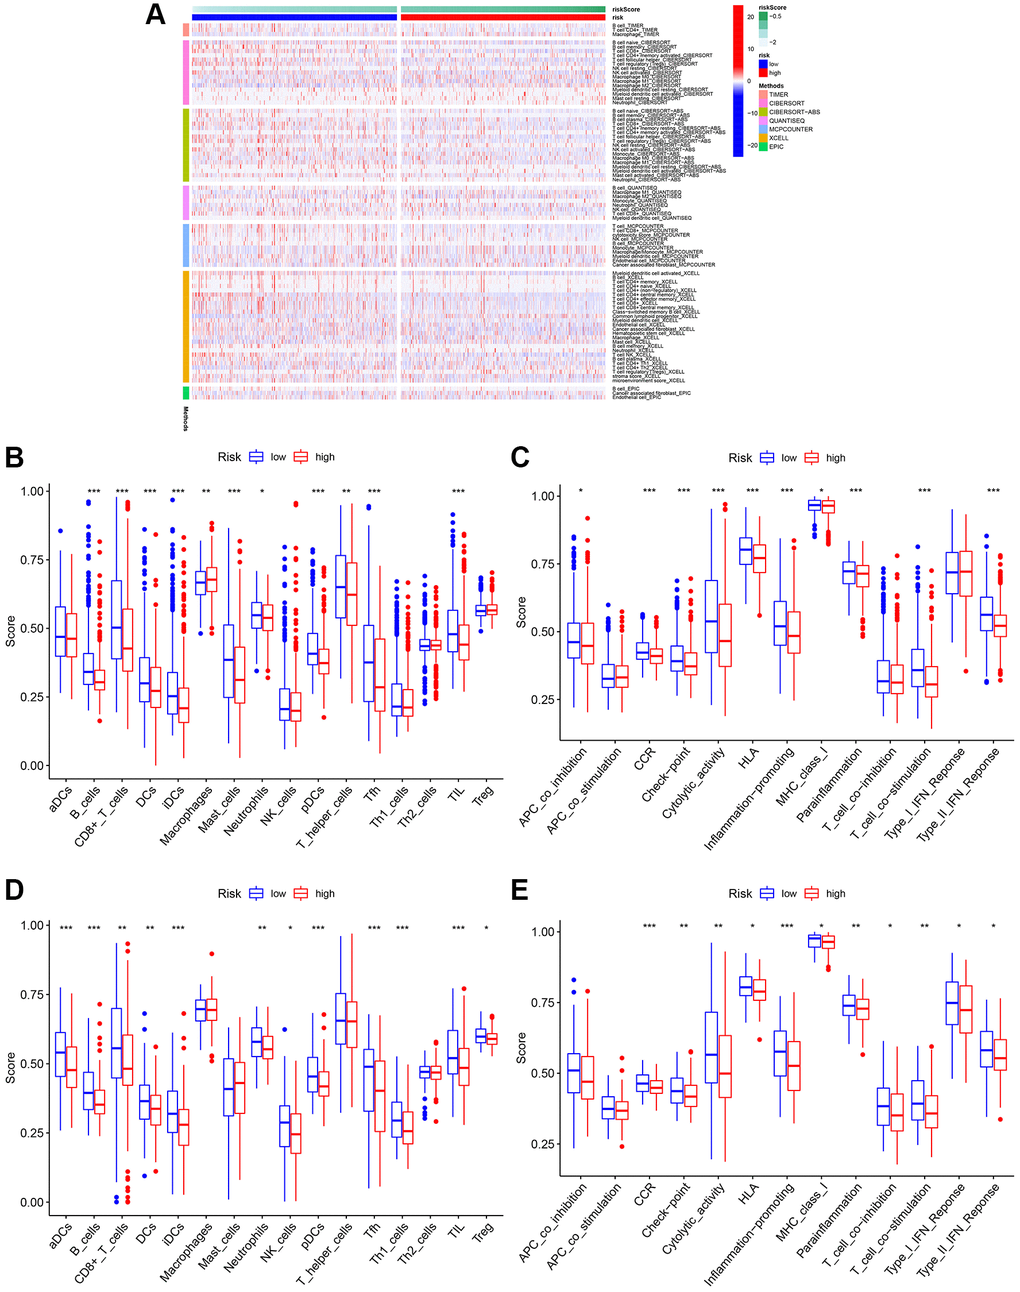
Figure 9.Analysis of immune cell infiltration. (A) Heatmap of immune cell infiltration. (B) Boxplot of immune cell infiltration in TCGA cohort. (C) Boxplot of immune function in TCGA cohort. (D) Boxplot of immune cell infiltration in GSE20685. (E) Boxplot of immune function in GSE20685.