Submit an Article
Navigate
Home
Editorial Board
Editorial Policies
Current Volume
Archive
Scientific Integrity
Publication Ethics Statements
Interviews with Outstanding Authors
Newsroom
Sponsored Conferences
Podcast
Contact
Special Collections
Submit an Article
Online ISSN: 1945-4589
Research Paper
|
Volume 14, Issue 15
|
pp. 6111–6127
Serial neurocognitive changes following transcatheter aortic valve replacement: comparison between low and intermediate-high risk groups
Back to article
Figure 4
(4 of 4)
−
100%
+
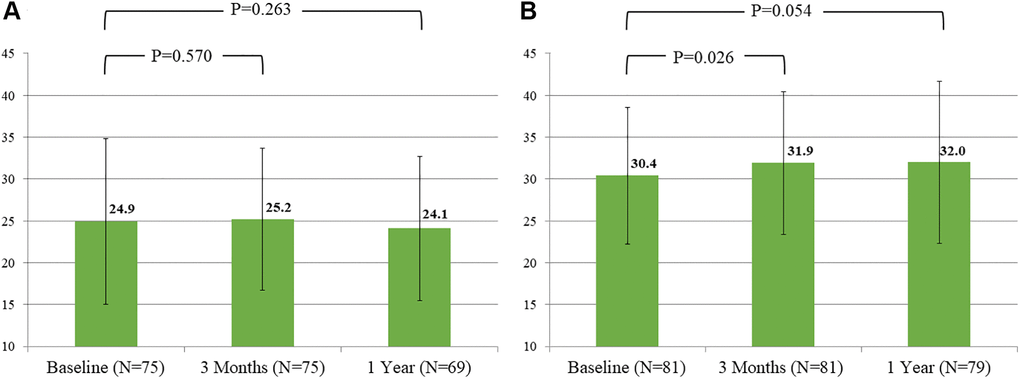
Figure 4.
Evolution of mean score of verbal fluency over time by groups.
(
A
) Intermediate-high risk group. (
B
) Low risk group.