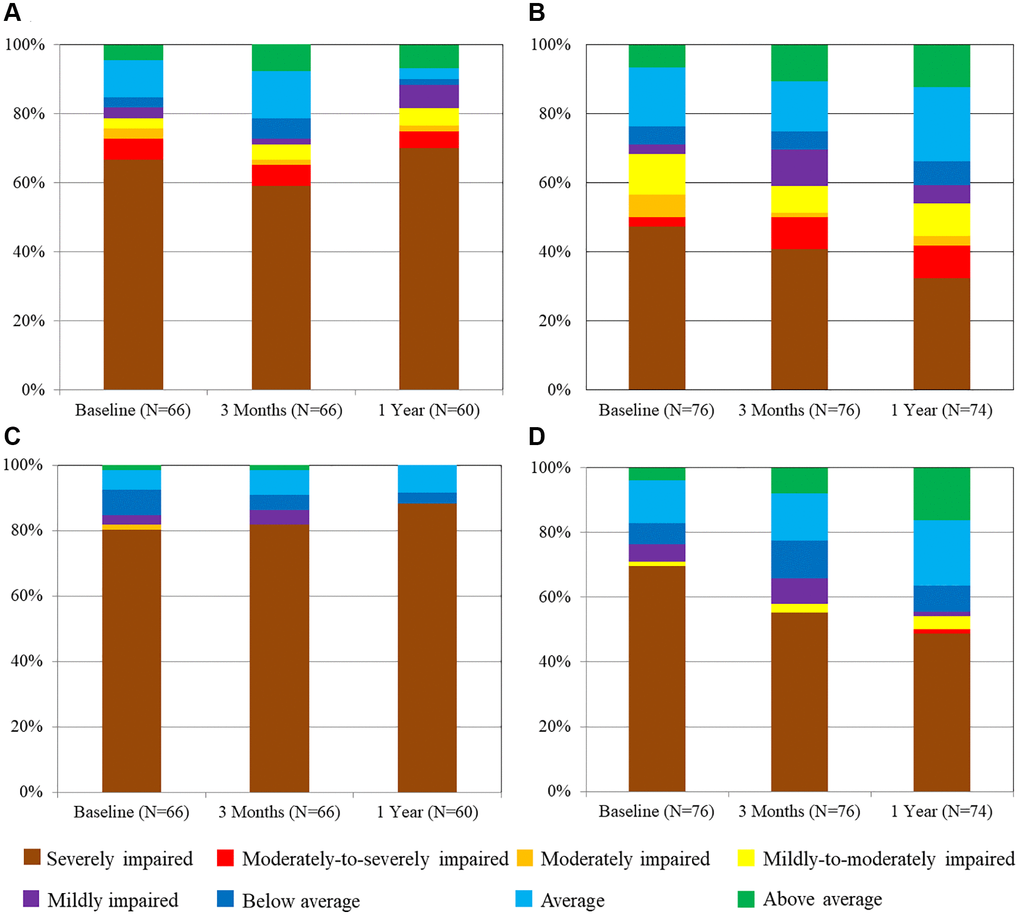
Figure 3.Evolution of the percentage of cognitive category in color trails test A and B over time. (A) Color Tails Test A in intermediate-high risk group. (B) Color Tails Test A in low-risk group. (C) Color Tails Test B in intermediate-high risk group. (D) Color Tails Test B in low-risk group.