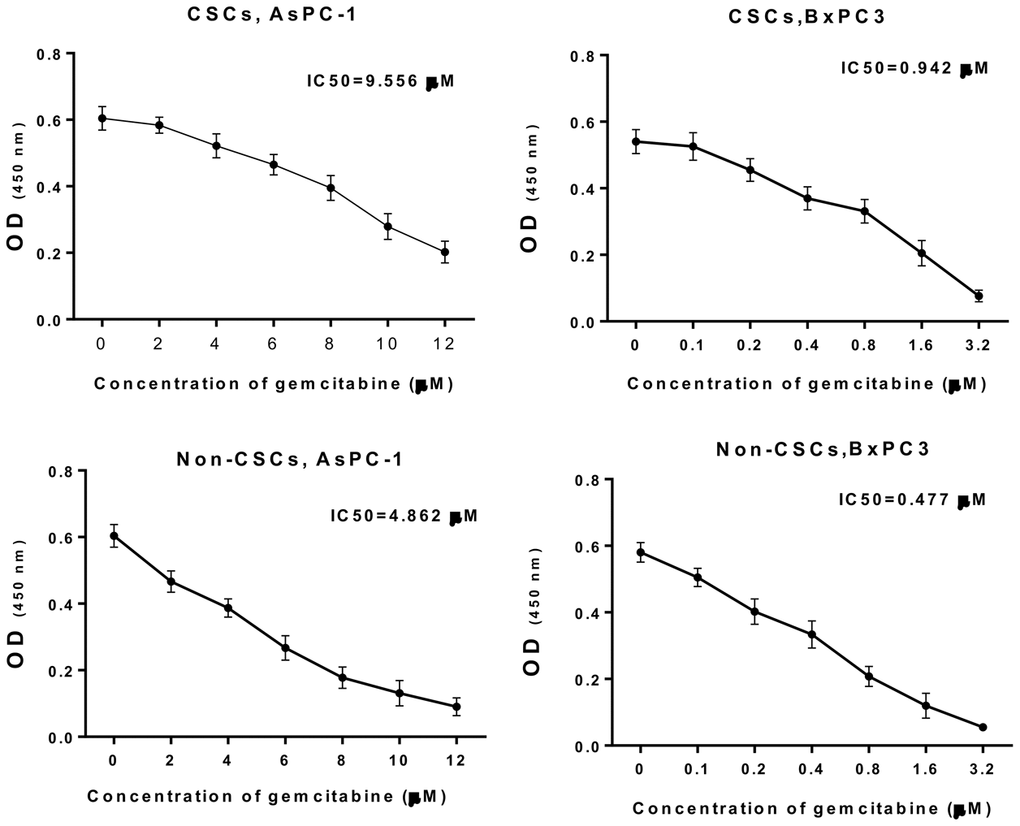
Figure 2.Gemcitabine resistance analysis of CSCs and non-CSCs from AsPC-1 and BxPC-3 cells. CSCs and non-CSCs from AsPC-1 and BxPC-3 cells were processed with different concentrations of gemcitabine for 24 h. Cell growth was determined with CCK-8 assay, and the IC50 values were calculated.