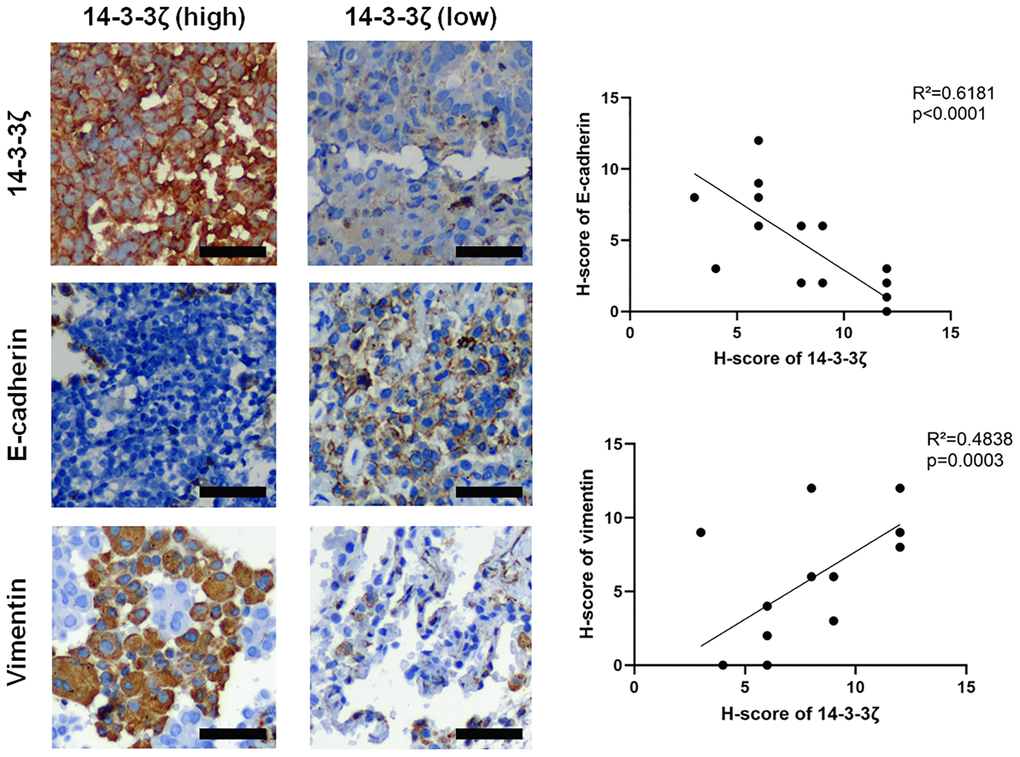
Figure 5.Representative IHC images of E-cadherin and vimentin in NSCLC tissues with different status of 14-3-3ζ. Scale bar = 200 μm. The linear regression analysis was used to determine the correlation between 14-3-3ζ, E-cadherin and vimentin, respectively.