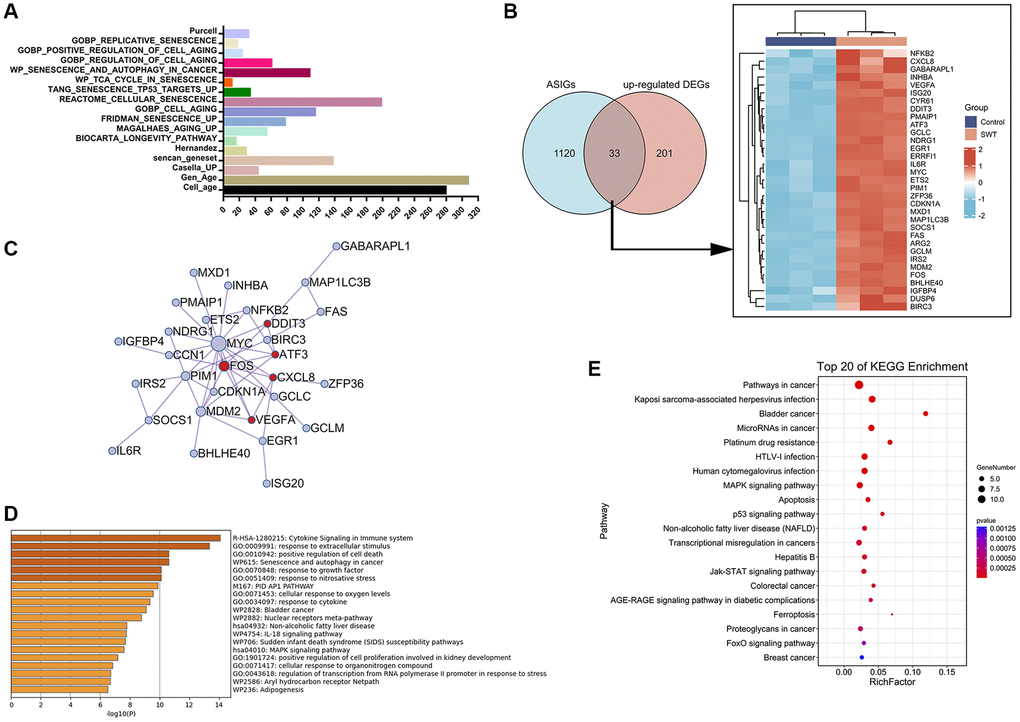
Figure 5.Venn diagram, network, and enrichment analyses of cellular aging/senescence-induced genes in SWT-treated MCF7 cells. (A) Bar graph representing 1153 aging/senescence-induced genes identified in 17 databases or studies. (B) Venn diagram and heatmap analysis of 33 ASIGs that were significantly upregulated by SWT. (C) PPI network analysis of 33 ASI-related DEGs. (D) Top 20 enriched terms associated with 33 ASI-related DEGs by Metascape database. (E) Top 20 KEGG pathways associated with 33 ASI-related DEGs.