Submit an Article
Navigate
Home
Editorial Board
Editorial Policies
Current Volume
Archive
Scientific Integrity
Publication Ethics Statements
Interviews with Outstanding Authors
Newsroom
Sponsored Conferences
Podcast
Contact
Special Collections
Submit an Article
Online ISSN: 1945-4589
Research Paper
|
Volume 14, Issue 14
|
pp. 5749–5767
Red blood cell distribution width in different time-points of peripheral thrombolysis period in acute ischemic stroke is associated with prognosis
Back to article
Figure 1
(1 of 5)
−
100%
+
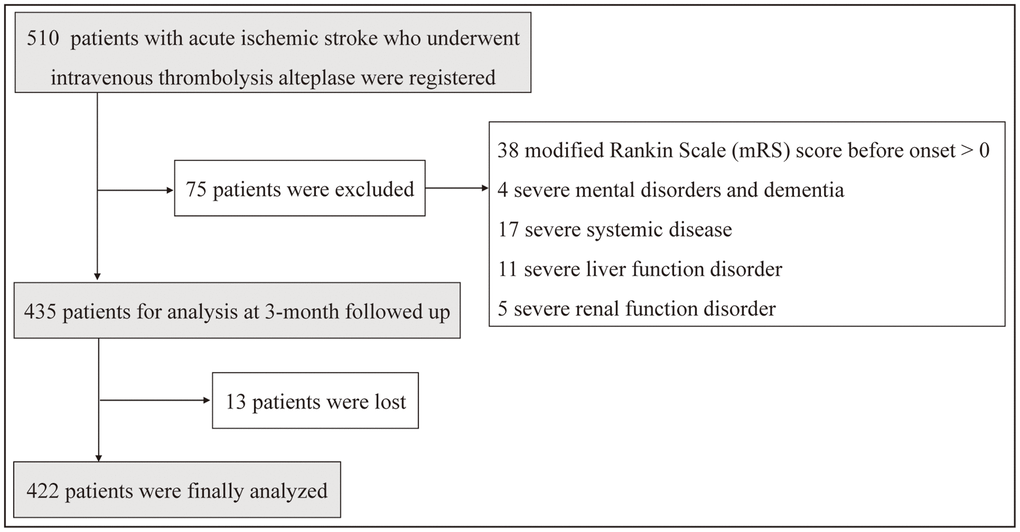
Figure 1.
Study flow chart showing the number of patients included in the final analysis.