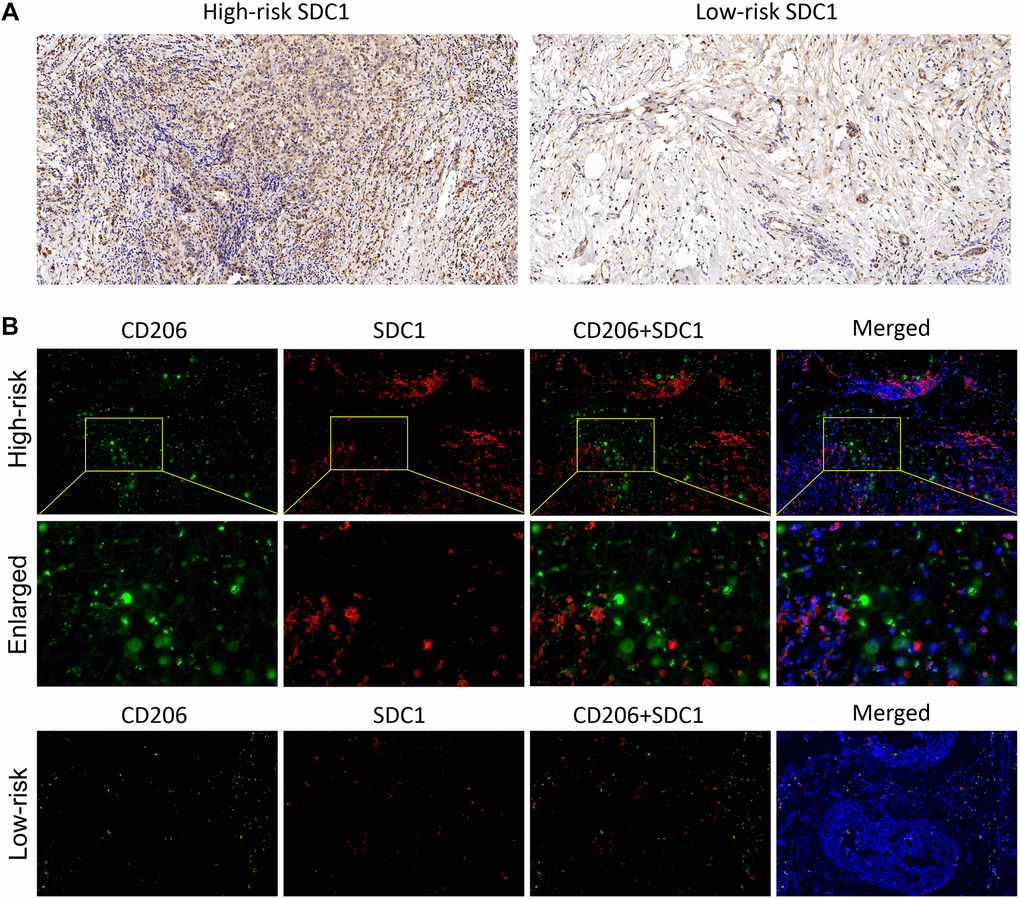
Figure 8.The SDC1 expression features in BC samples. (A) The IHC assay showed the SDC1 expression level in the high-risk and low-risk patients. (B) The IF assay verified the SDC1 and CD206 expression levels, as well as their co-expression in the high-risk and low-risk patients. CD206, green; SDC1, red; DAPI, nucleus.