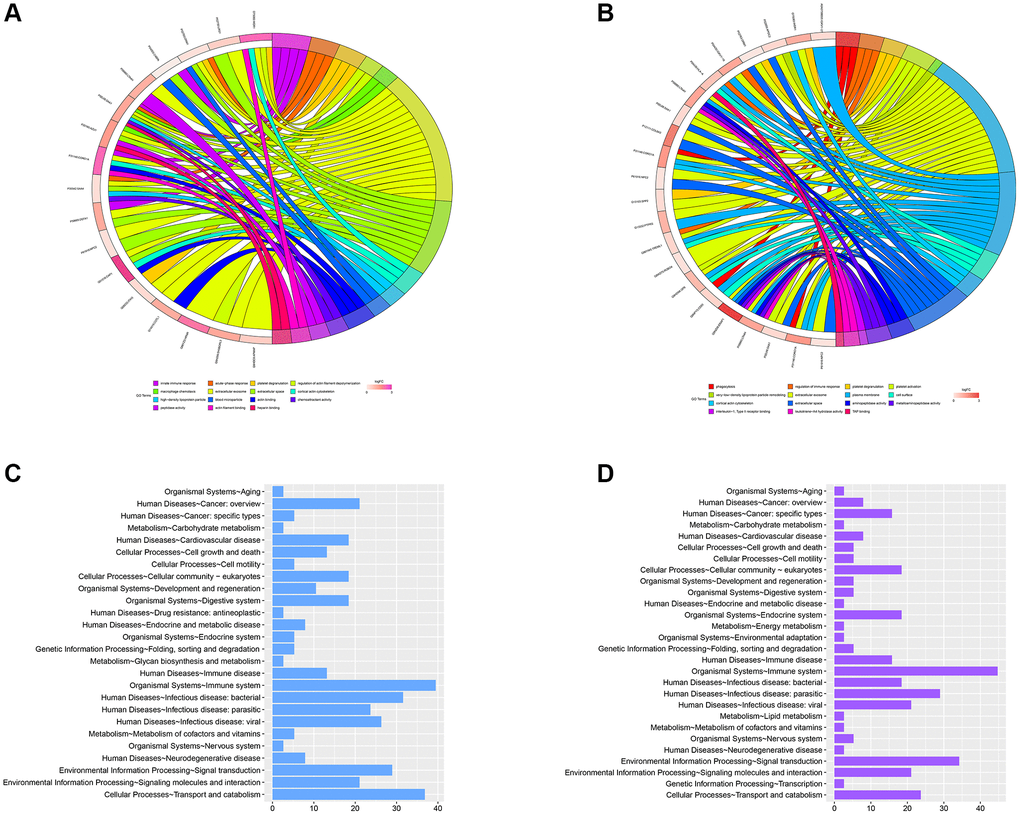
Figure 6.GO analysis of the significant MEmagenta and MEred modules in the TAMG (+) and TAMG (−) groups. (A, B) GO annotation for module’s DEPs. (C, D) KEGG pathway analysis of MEmagenta module.
Figure 6 — Integrated proteomics and metabolomics analysis reveals hubs protein and network alterations in myasthenia gravis | Aging