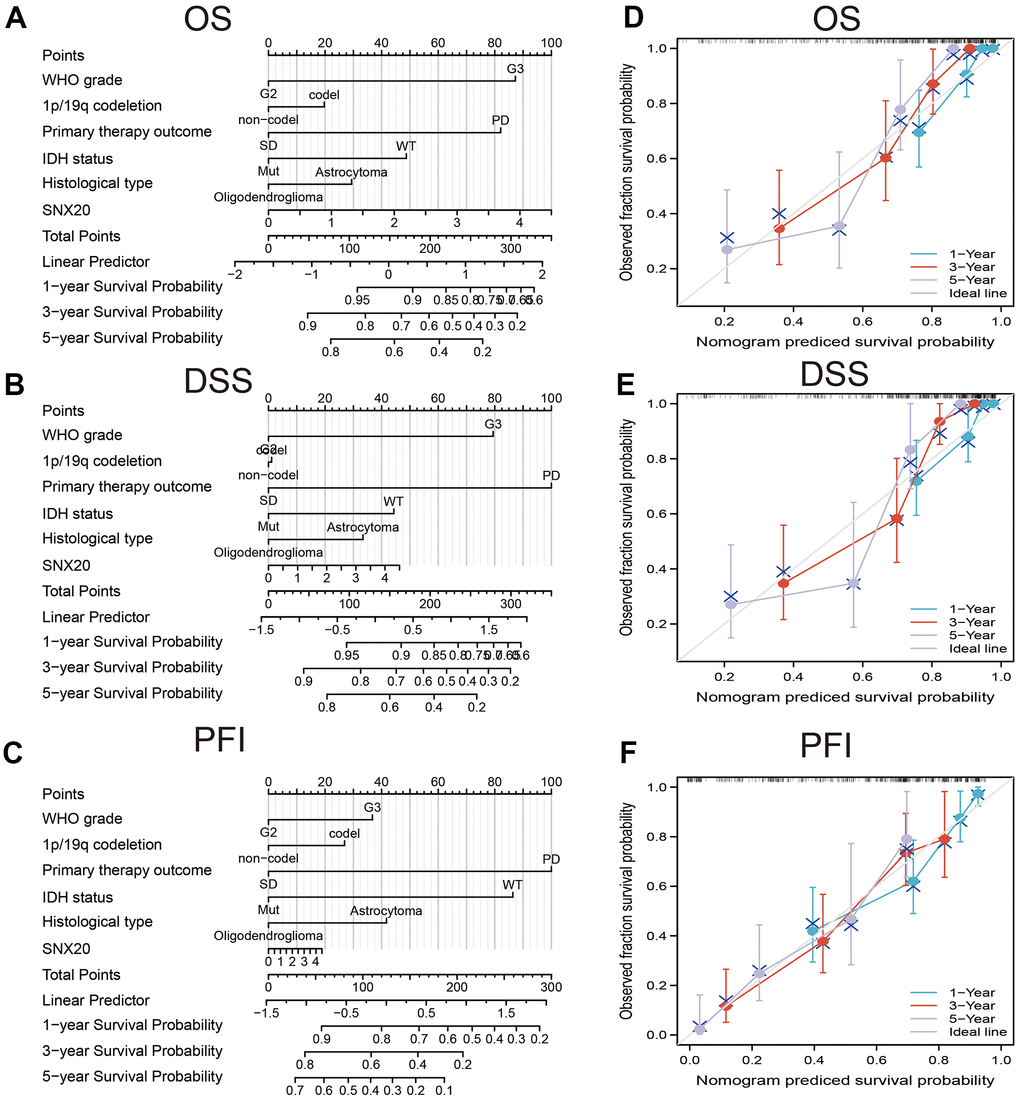
Figure 4.Construction nomogram of predicted prognosis of SNX20 in LGG. Construction nomogram to predicted (A) OS, (B) DSS, and (C) PFI in LGG patients. The calibration curve used to display the TCGA-LGG cohort for (D) OS, (E) DSS and (F) PFI.
Figure 4 — DNA methylation-regulated SNX20 overexpression correlates with poor prognosis, immune cell infiltration, and low-grade glioma progression | Aging