Submit an Article
Navigate
Home
Editorial Board
Editorial Policies
Current Volume
Archive
Scientific Integrity
Publication Ethics Statements
Interviews with Outstanding Authors
Newsroom
Sponsored Conferences
Podcast
Contact
Special Collections
Submit an Article
Online ISSN: 1945-4589
Research Paper
|
Volume 14, Issue 10
|
pp. 4572–4585
Lactotransferrin promotes intervertebral disc degeneration by regulating Fas and inhibiting human nucleus pulposus cell apoptosis
Back to article
Figure 3
(3 of 10)
−
100%
+
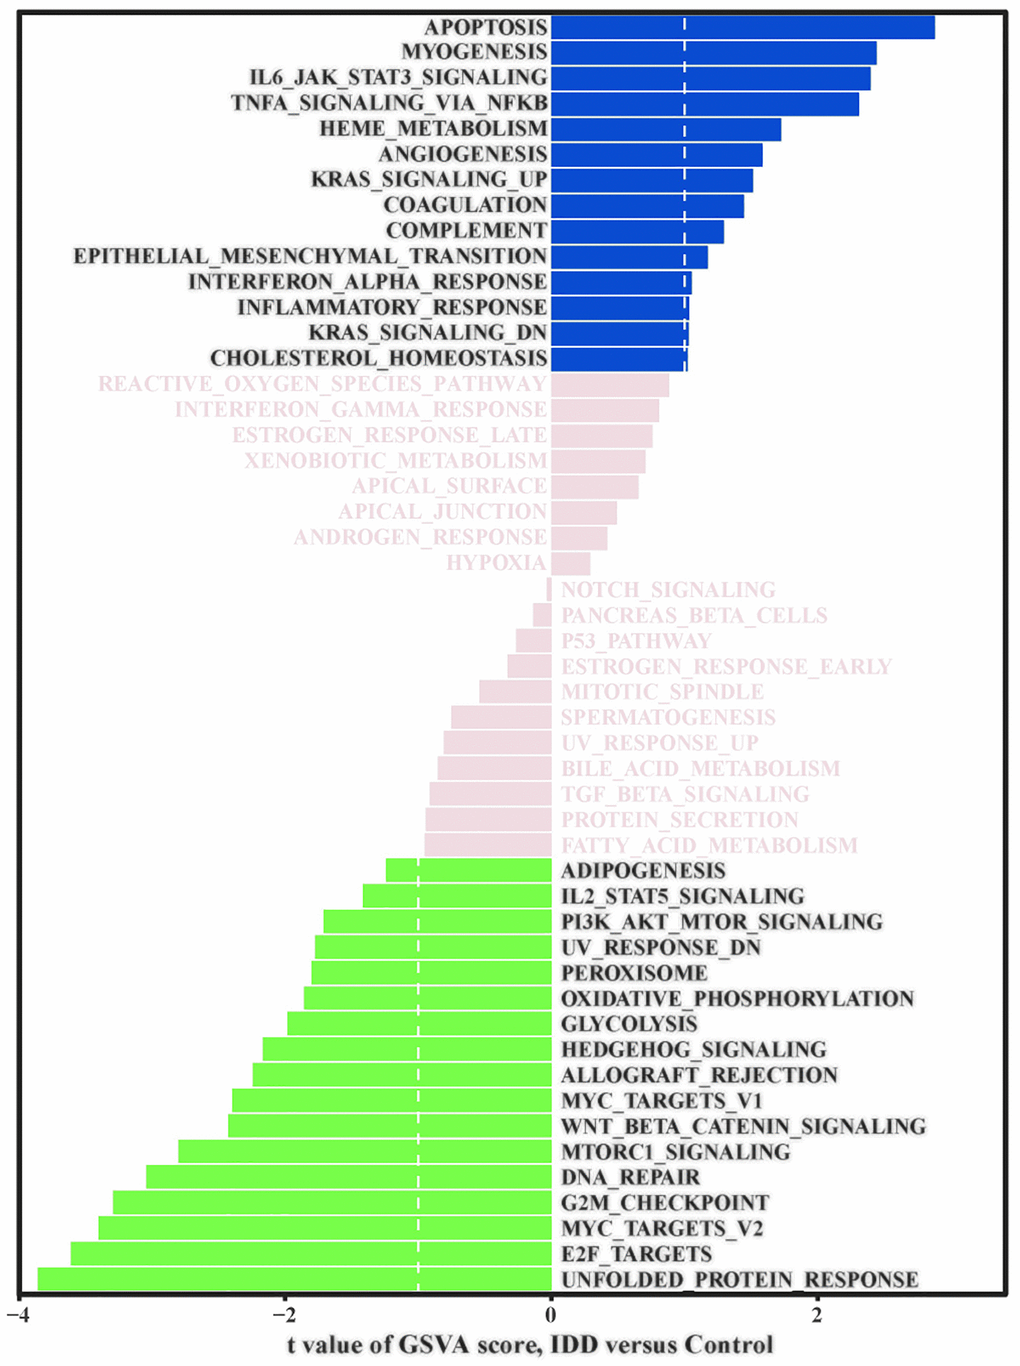
Figure 3.
GSVA signal path analysis.
GSVA score between IDD and normal group samples; t value is displayed from the linear model, we set |t|>1 as the cutoff value.