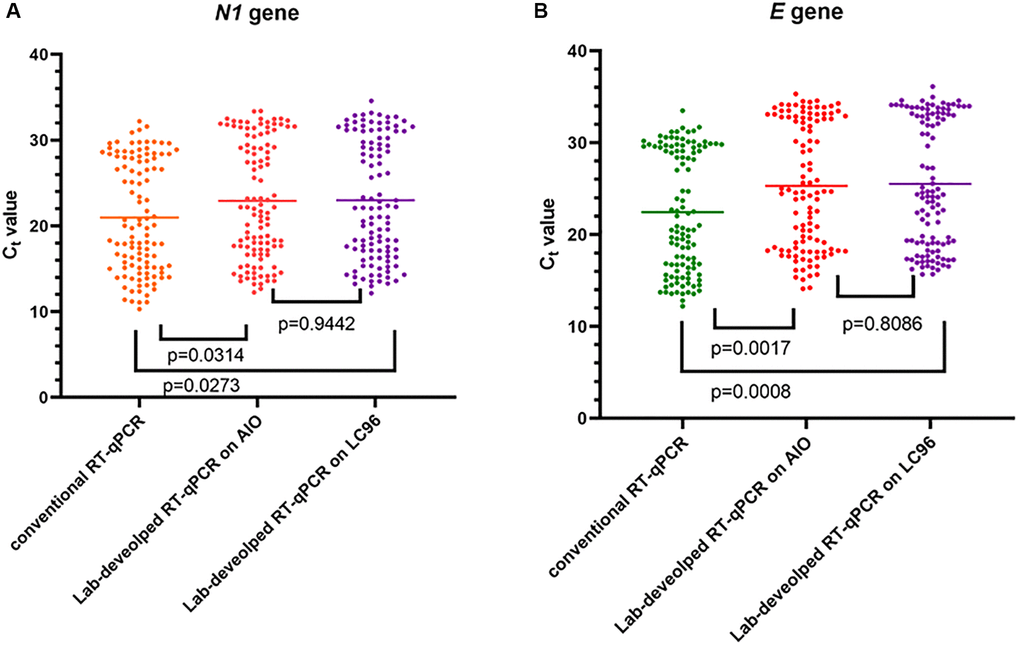
Figure 1.Detection of SARS-CoV-2 using two methods on two different machines. Data are depicted as scattered dot plots with stated mean values. Each dot represents one Ct value corresponding with one specimen and p-values were found using paired t-test. (A) Shows SARS-CoV-2 N1 gene results. (B) Shows SARS-CoV-2 E gene results.