Submit an Article
Navigate
Home
Editorial Board
Editorial Policies
Current Volume
Archive
Scientific Integrity
Publication Ethics Statements
Interviews with Outstanding Authors
Newsroom
Sponsored Conferences
Podcast
Contact
Special Collections
Submit an Article
Online ISSN: 1945-4589
Research Paper
|
Volume 14, Issue 11
|
pp. 4714–4727
TLR3 deletion inhibits programmed necrosis of brain cells in neonatal mice with sevoflurane-induced cognitive dysfunction
Back to article
Figure 3
(3 of 7)
−
100%
+
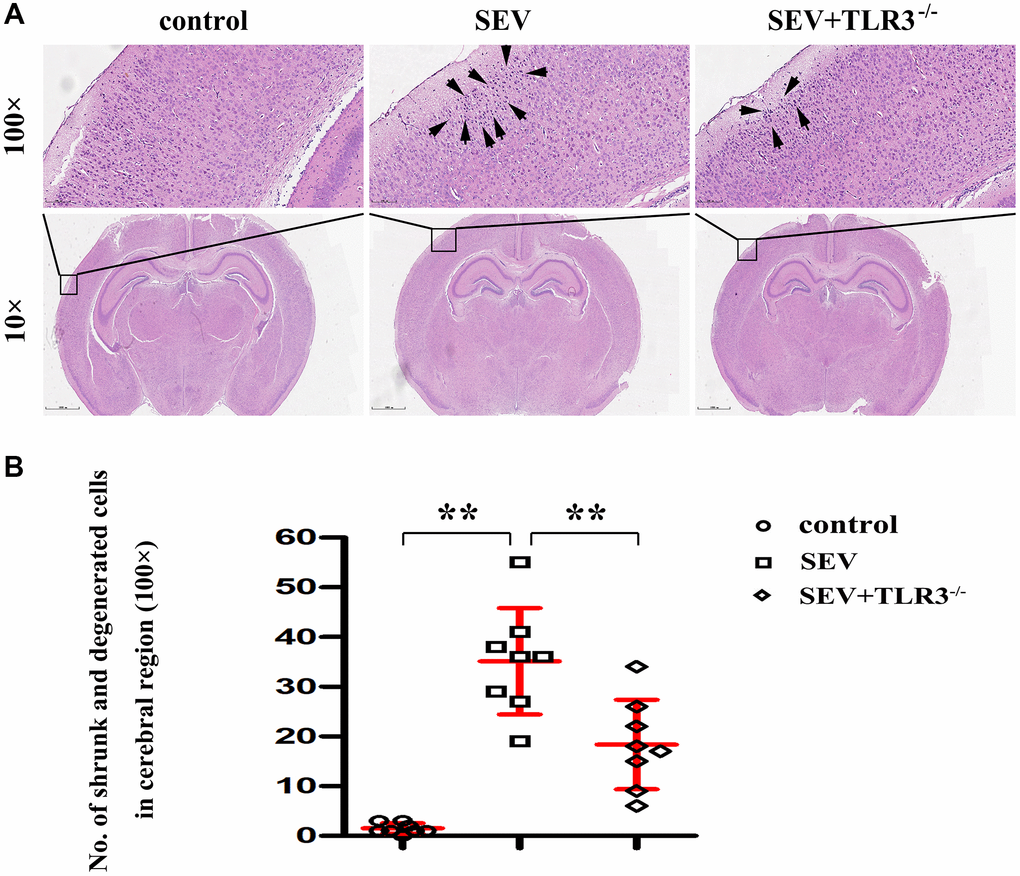
Figure 3.
(
A
) Pathological changes (HE staining) in the cortical and hippocampal regions of neonatal mice (Magnification is 100× and 400×, respectively), (
B
) Statistical chart of pathological changes in cortical regions.