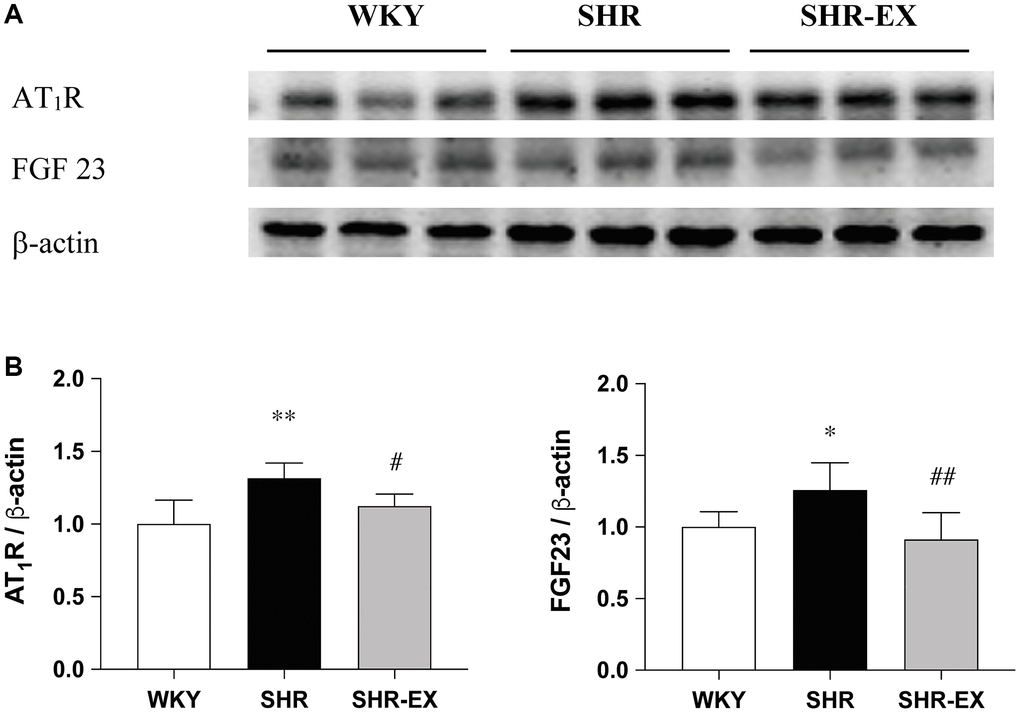
Figure 2.Effects of exercise training on the AT1R and FGF23. (A) The representative protein quantification of AT1R and FGF23 extracted from the left ventricles were measured by Western blotting analysis; (B) Bars represent the densitometric analysis of AT1R and FGF23. Data are expressed as the mean values ± SD (n = 8 in each group). *p < 0.05, **p < 0.01 vs. WKY group. #p < 0.05, ##p < 0.01 the SHR group vs. SHR-EX group.