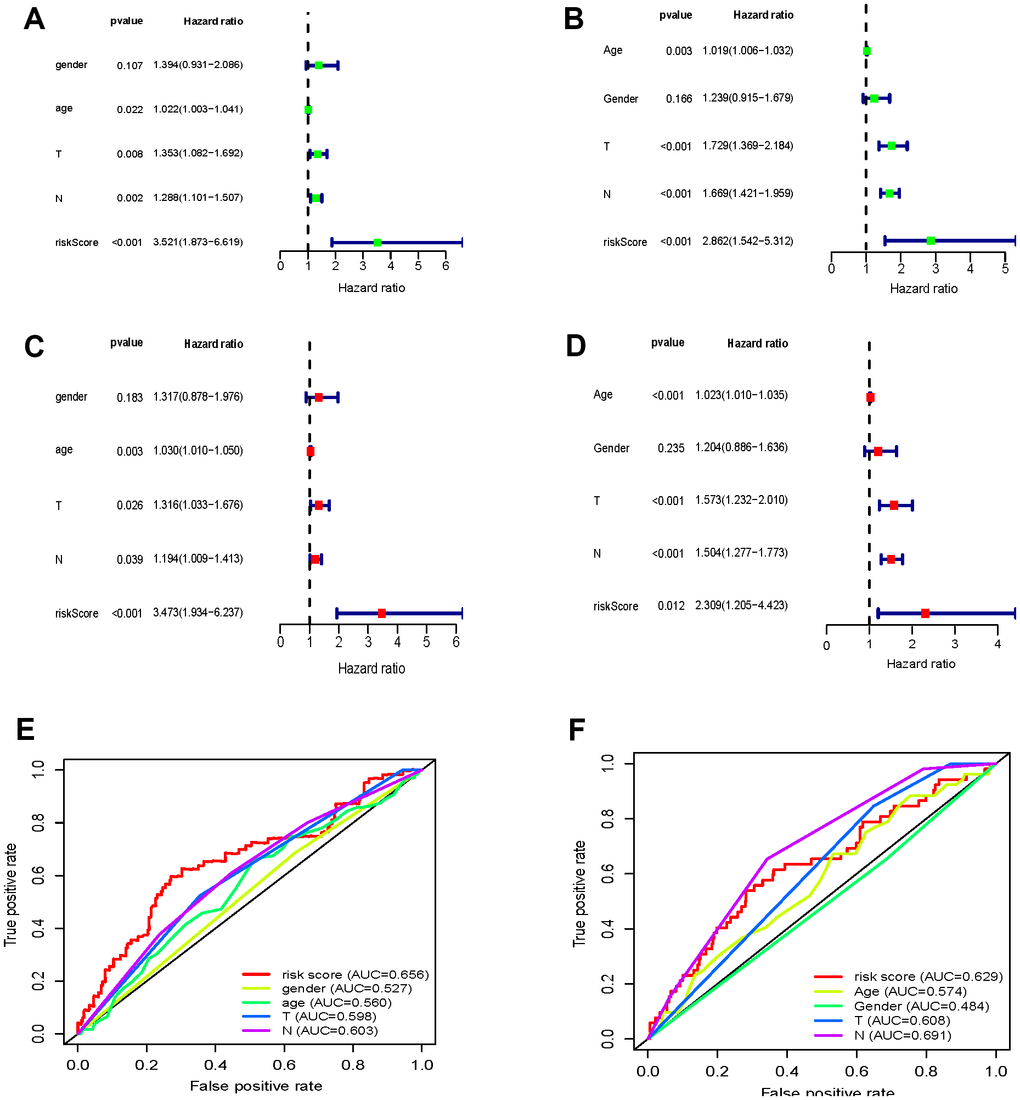
Figure 2.Cell cycle-associated genes significantly correlated with survival rates of GC patients. (A–D) Forrest plots of univariate and multivariate Cox regression analysis (E, F) OS sensitivity and specificity analysis for the risk score determined by the expression of seven genes in TCGA-STAD (E) and GSE84437 (F) based on ROC analysis.