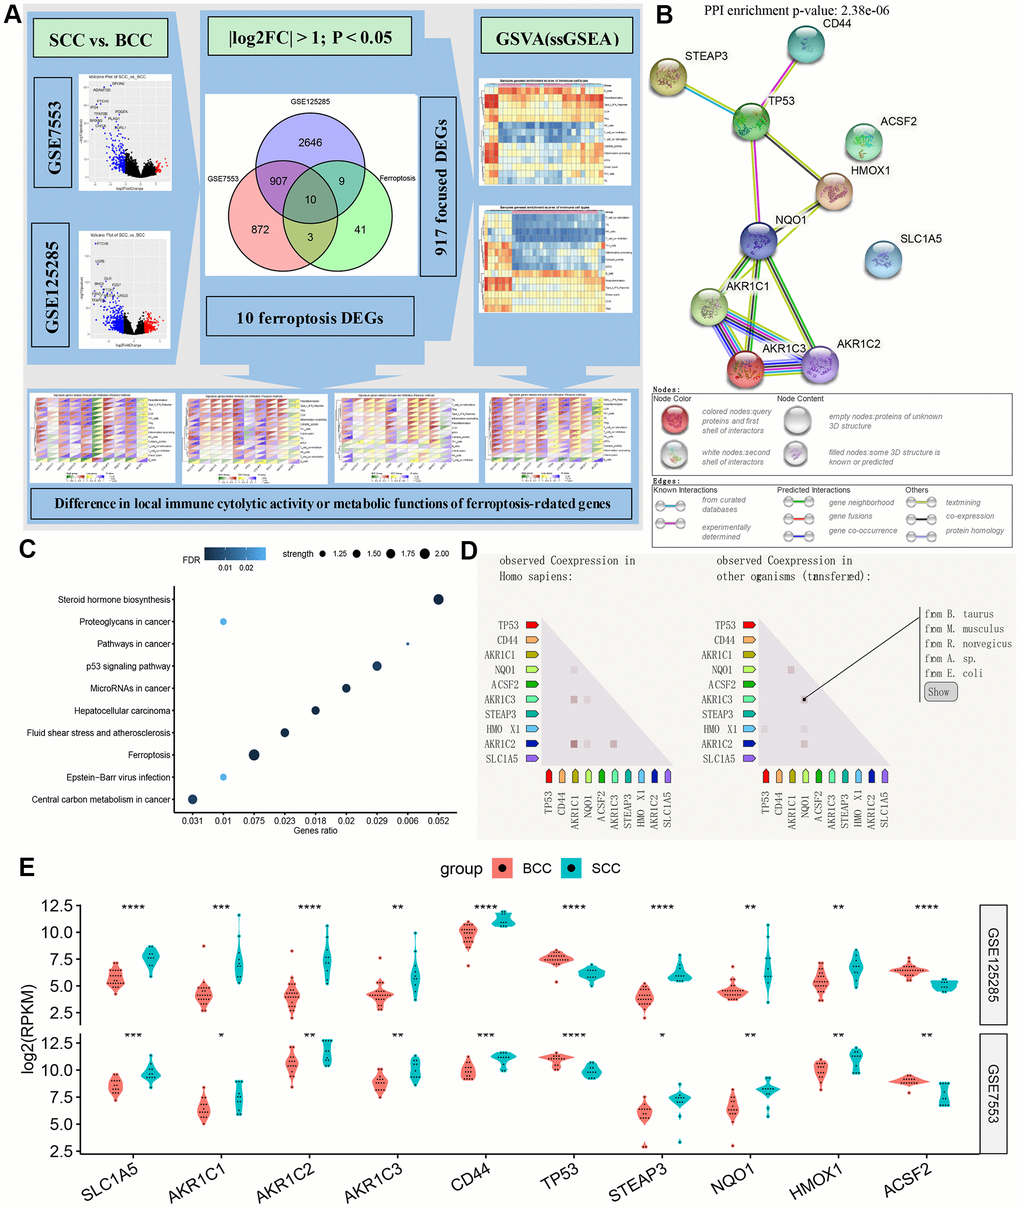
Figure 1.Overview of ferroptosis genes. (A) Flow chart of DEG gene set and iron death gene acquisition. (B–D) The protein-protein interaction network diagram, biological functions and (homologous) co-expression results of ferroptosis genes. (E) Differences in the expression of ferroptosis-related genes between BCC and SCC in the two data sets. (*P<0.05,**P<0.01, ***P<0.001, ****P<0.0001).