Submit an Article
Navigate
Home
Editorial Board
Editorial Policies
Current Volume
Archive
Scientific Integrity
Publication Ethics Statements
Interviews with Outstanding Authors
Newsroom
Sponsored Conferences
Podcast
Contact
Special Collections
Submit an Article
Online ISSN: 1945-4589
Research Paper
|
Volume 14, Issue 9
|
pp. 3782–3800
Transcriptional expressions of hsa-mir-183 predicted target genes as independent indicators for prognosis in bladder urothelial carcinoma
Back to article
Figure 3
(3 of 13)
−
100%
+
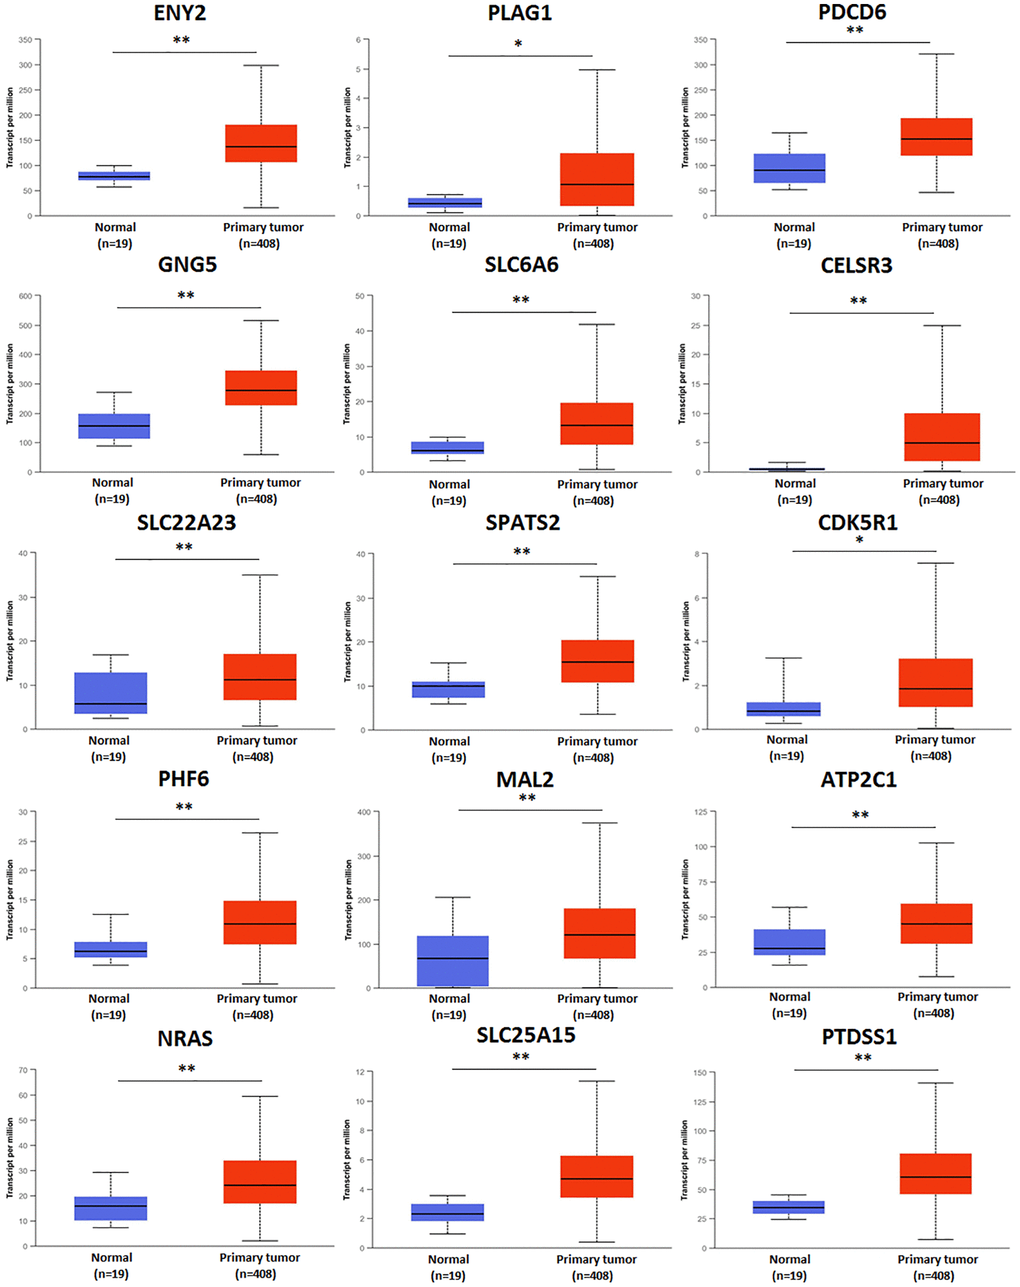
Figure 3.
Transcriptional expression of predicted target genes of hsa-mir-183 in BLCA based on TCGA sample types.
(
**
P
< 0.001,
*
P
< 0.01).
Figure 3 — Transcriptional expressions of hsa-mir-183 predicted target genes as independent indicators for prognosis in bladder urothelial carcinoma | Aging