Submit an Article
Navigate
Home
Editorial Board
Editorial Policies
Current Volume
Archive
Scientific Integrity
Publication Ethics Statements
Interviews with Outstanding Authors
Newsroom
Sponsored Conferences
Podcast
Contact
Special Collections
Submit an Article
Online ISSN: 1945-4589
Research Paper
|
Volume 14, Issue 8
|
pp. 3687–3704
F12 as a reliable diagnostic and prognostic biomarker associated with immune infiltration in papillary thyroid cancer
Back to article
Figure 4
(4 of 11)
−
100%
+
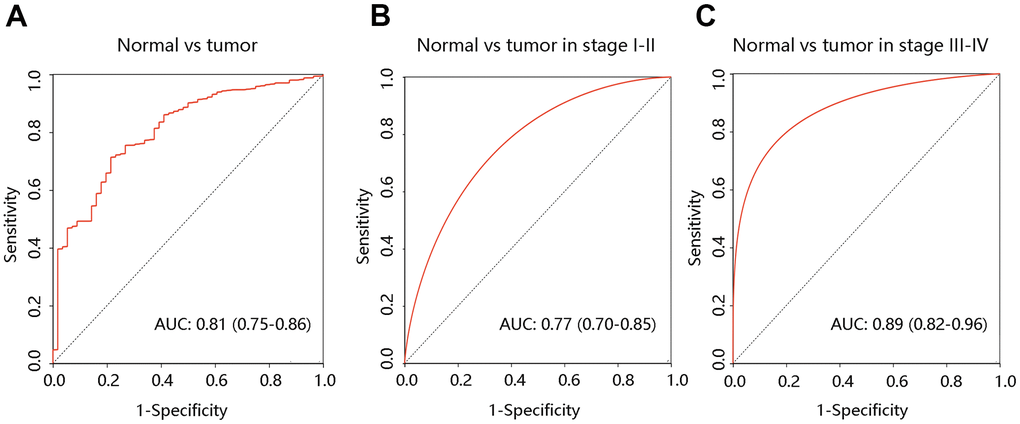
Figure 4.
Diagnostic value of F12 in PTC.
The ROC curves of F12 expression in PTC vs normal tissues (
A
) and different clinical stages (
B
,
C
). PTC, papillary thyroid cancer; ROC, receiver operating characteristic; AUC, the area under the curve.