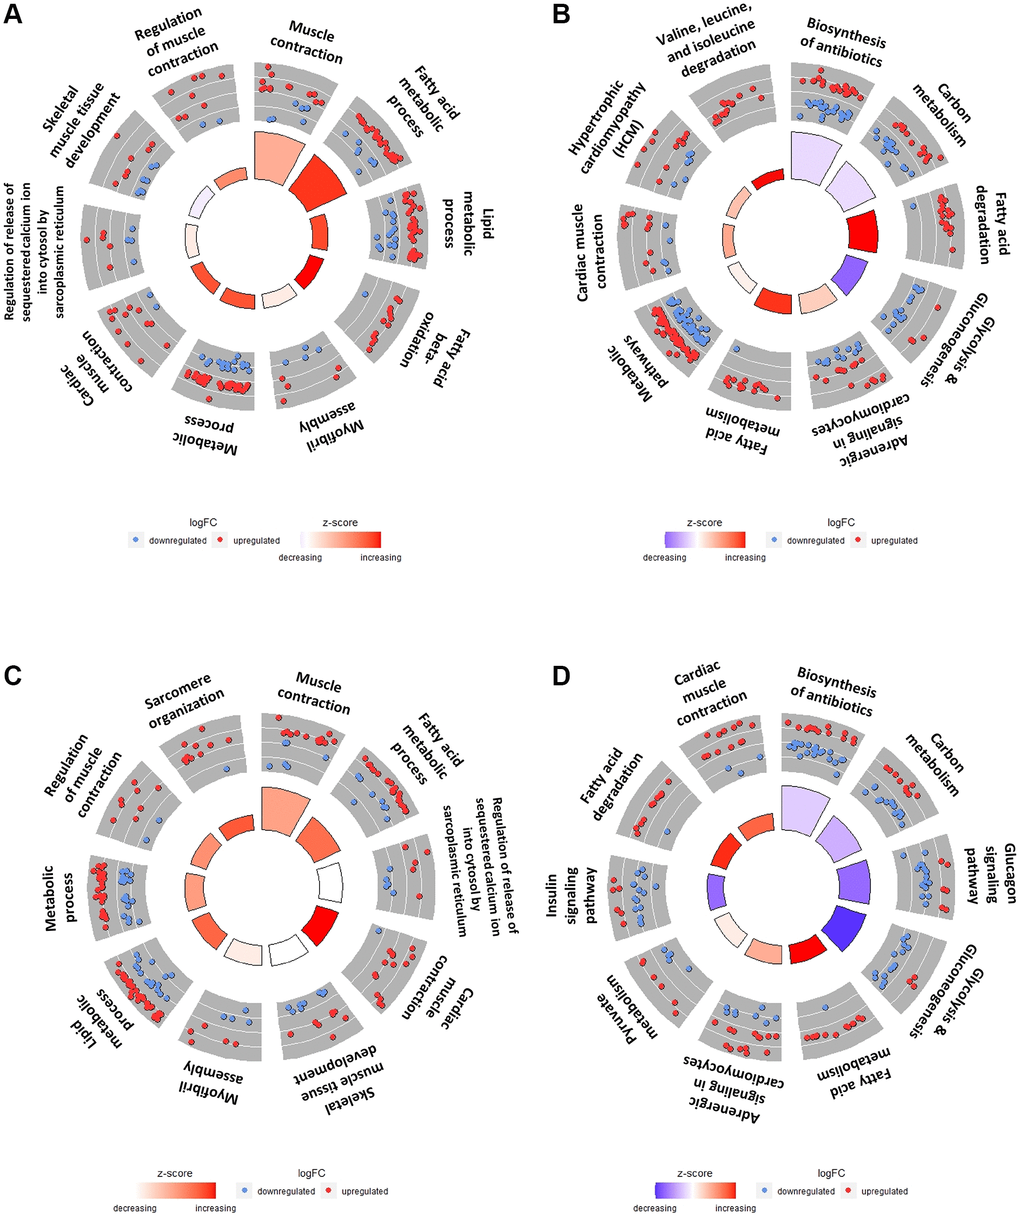
Figure 5.Top 10 GO terms and KEGG pathways of DEGs in SOL vs. GAS in young and old groups. The red points indicate upregulated DEGs, while the blue points indicate downregulated DEGs in the outer circle. The z-score is represented by the color of the inner circle. (A) Top 10 GO terms using DEGs in the SOL YC/GAS YC. (B) Top 10 KEGG pathway plots using DEGs in the SOL YC/GAS YC. (C) Top 10 GO terms by DEGs in SOL OC/GAS OC. (D) Top 10 KEGG pathway plots of SOL OC/GAS OC. For detailed adjusted p-values and z-scores, refer to the Tables 4, 5. For significantly enriched pathway other than top 10, refer to the Supplementary Tables 3–6.
Figure 5 — Muscle fiber type-dependence effect of exercise on genomic networks in aged mice models | Aging