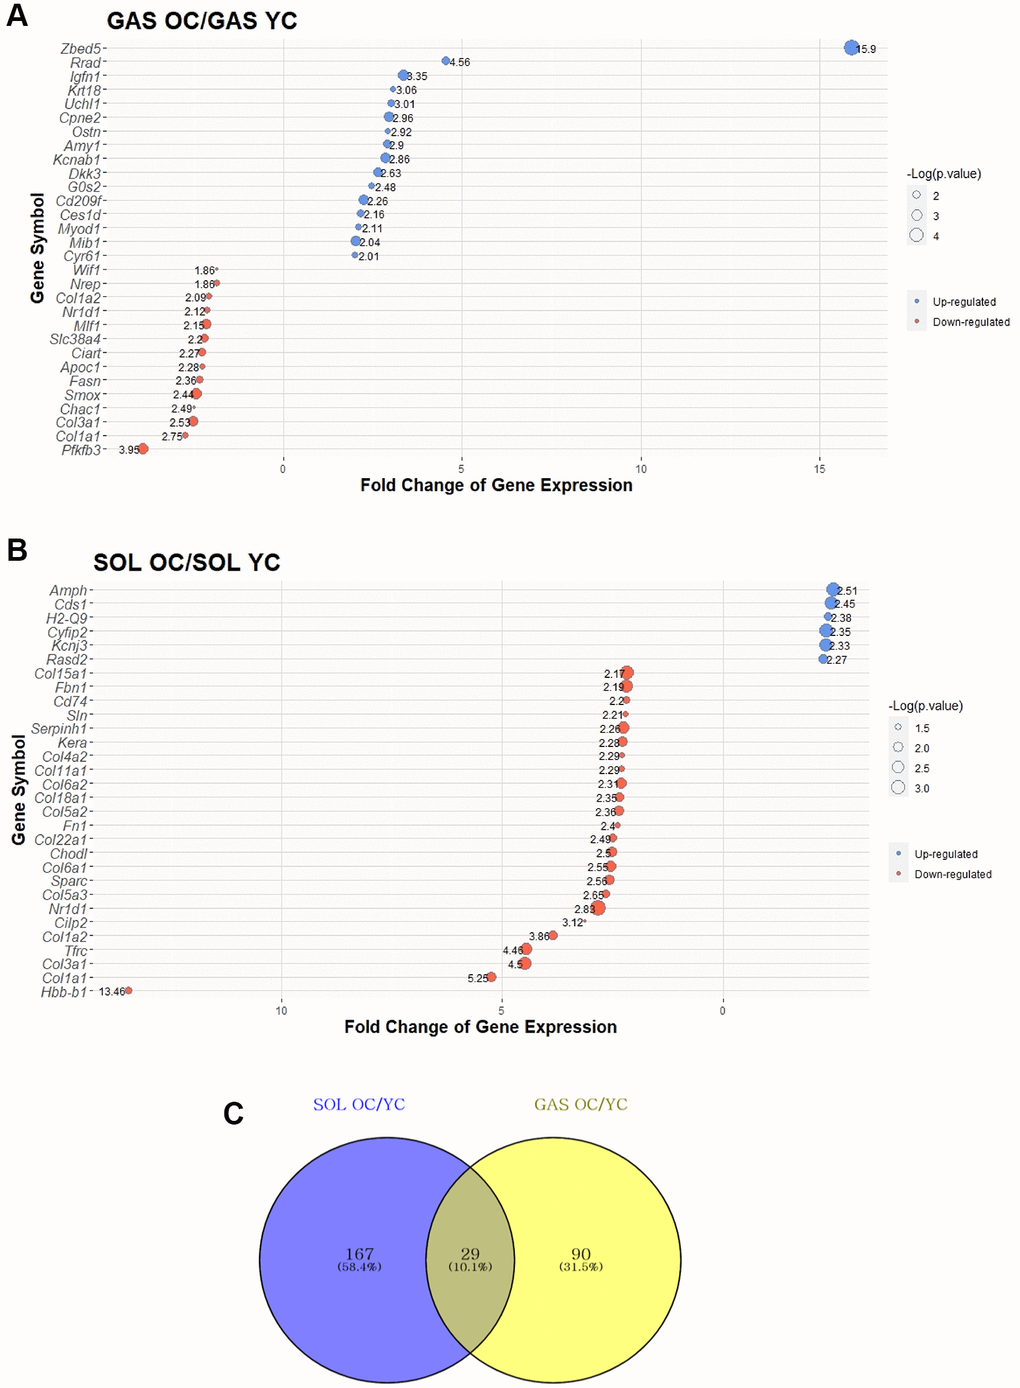
Figure 2.Top 30 DEGs between “YC vs. OC” in SOL and GAS and Venn diagram to find commonly expressed DEGs. The point sizes of (A) and (B) represent ‒log10 (p-value). For (A) and (B), blue points indicate upregulated genes, and red points indicate downregulated genes. (A) Top 30 DEGs in GAS OC/YC. (B) Top 30 DEGs in SOL OC/YC. (C) Venn diagram of DEGs between YC and OC in SOL and GAS. For commonly expressed genes, detailed fold changes and p-values are shown in the Table 1.