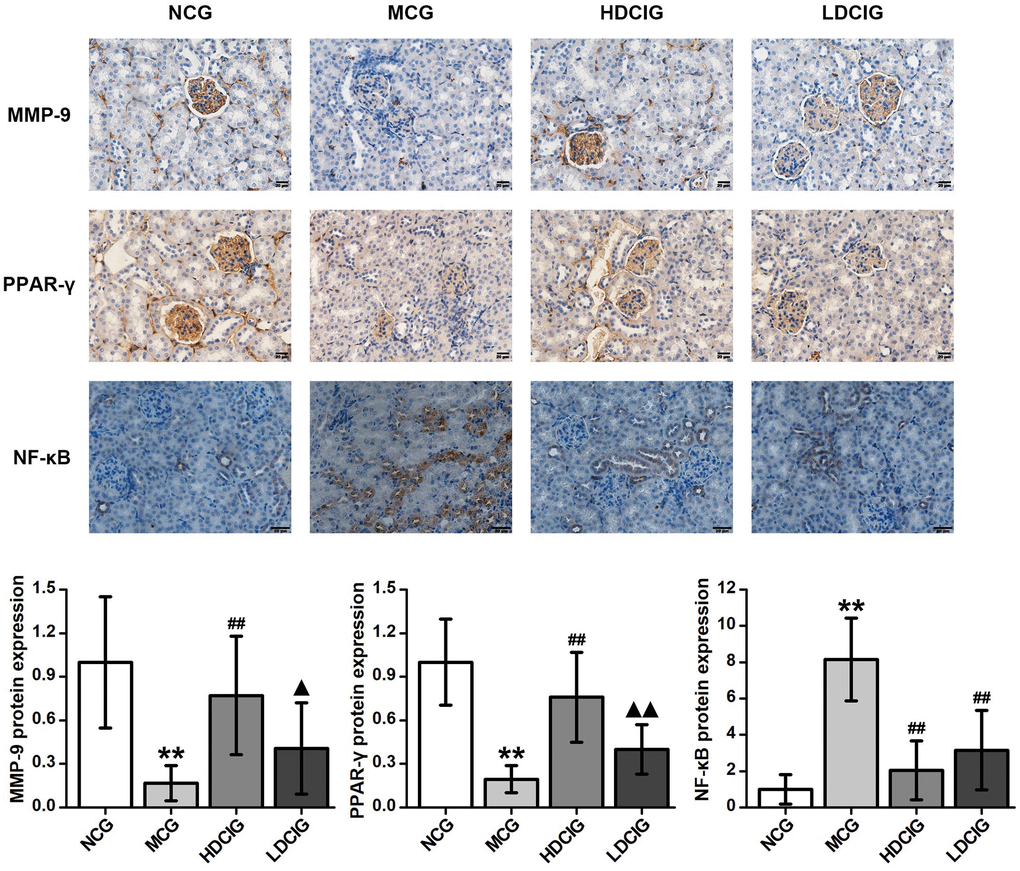
Figure 2.Immunohistochemistry determination of the relative protein expression in the kidney tissues of db/db mice (n = 4). The results obtained for the different groups were normalized to those reported in the normal control group (NCG). All values are expressed as the means ± SD. *p < 0.05, **p < 0.01 vs. NCG mice; #p < 0.05. ##p < 0.01 vs. MCG mice. ▲p < 0.05, ▲▲p < 0.01 vs. HDCIG mice.