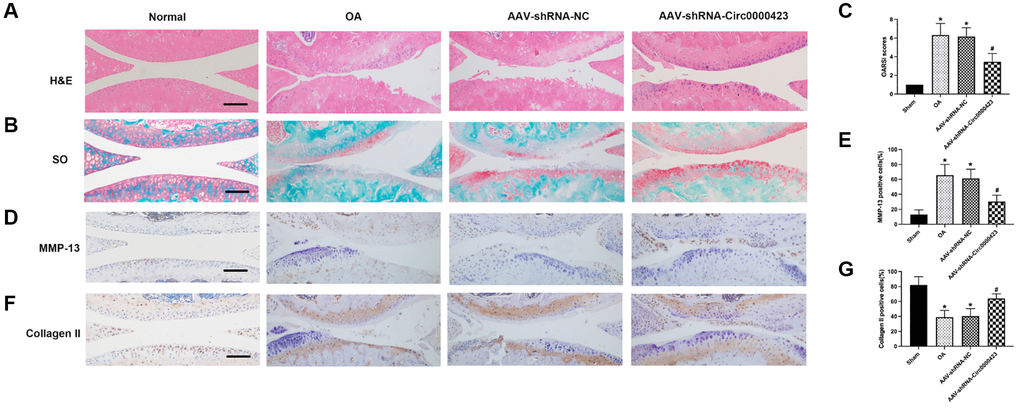
Figure 5.Circ_0000423 regulates the progression of OA in ACLT mice. (A, B) Histological analysis of OA was measured by HE staining and Safranin O staining. (C) OARSI scores were used to measure the progression of OA. (D–F) Immunohistochemical analyses of MMP-13 and Collagen II in sagittal sections of the medial condyle. (E–G) Quantification of MMP-13 and Collagen II-positive cells. P values were computed vs. controls group* or ACLT group#; (*, #) P < 0.05. (Scale bar = 50 μm).