Submit an Article
Navigate
Home
Editorial Board
Editorial Policies
Current Volume
Archive
Scientific Integrity
Publication Ethics Statements
Interviews with Outstanding Authors
Newsroom
Sponsored Conferences
Podcast
Contact
Special Collections
Submit an Article
Online ISSN: 1945-4589
Research Paper
|
Volume 14, Issue 7
|
pp. 3030–3048
Skin cutaneous melanoma properties of immune-related lncRNAs identifying potential prognostic biomarkers
Back to article
Figure 9
(9 of 12)
−
100%
+
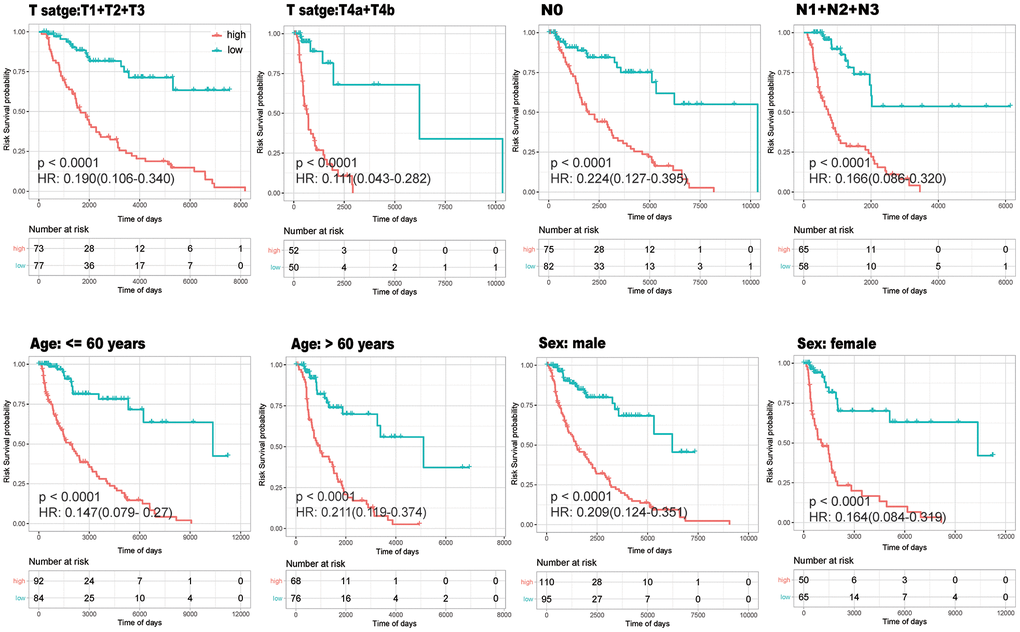
Figure 9.
Stability Analysis of the model.
K-M curves drawn within different subgroups according to high- (red) and low-(green)risk groups to verify whether the model was stable in different age, gender and tumor condition.